
 Worksheets
Line Graphs and Line Plots
Total questions: 25
Worksheet time: 20mins
Name
Class
Date
1.

What is the name of this graph?
a)
line plot
b)
line graph
c)
bar graph
d)
frequency table
2.

What is the main purpose of a line graph?
a)
to compare two things
b)
to show trends over time
c)
to have an independent variable
d)
so you don't have to read words
3.

What is the general trend of this line graph?
a)
The more you mow, the less money you make.
b)
You make the same amount of money regardless of how long you mow.
c)
The more you mow, the more money you make.
d)
Mowing is dangerous.
4.

How much does it cost to have your lawn mowed for 2 hours?
a)
$16
b)
$17
c)
$18
d)
$19
5.

Look at the graph.
Which is correct?
Sales of food and drink... from Monday to Friday.
Which is correct?
Sales of food and drink... from Monday to Friday.
a)
remain stable
b)
rise
c)
drop
d)
fluctuate
6.
At which age do the least amount of teens have a cell phone?
a)
18
b)
14
c)
13
d)
15
7.
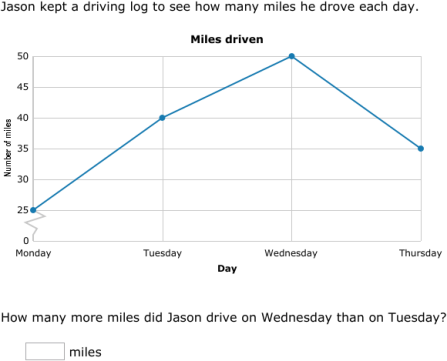
How many more miles did Jason drive on Wednesday than on Tuesday?
a)
40 miles
b)
10 miles
c)
5 miles
d)
50 miles
8.

What is the difference between Jill's 12th grade math score and her 7th grade math score?
a)
72
b)
91
c)
21
d)
19
9.

When was the greatest amount of shoppers at the store?
a)
10am
b)
1pm
c)
6pm
d)
2pm
10.
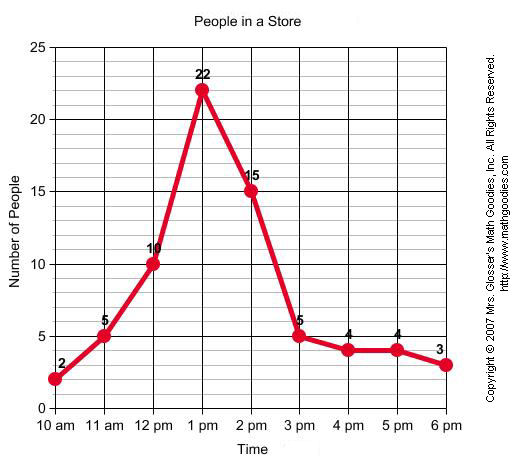
Between which two times was the greatest increase in number of shoppers?
a)
12pm and 1pm
b)
1pm and 2pm
c)
2pm and 3pm
d)
10am and 11am
11.

How many push-ups were done on Monday?
a)
5
b)
10
c)
15
d)
20
12.

Between which two days was the greatest decrease in push-ups?
a)
Friday and Saturday
b)
Tuesday and Wednesday
c)
Sunday and Monday
d)
Thursday and Friday
13.

What was the bear population in 2001?
a)
40
b)
45
c)
50
d)
55
14.

Between which two years did the bear population remain constant?
a)
2004 and 2005
b)
2001 and 2002
c)
2005 and 2006
d)
2000 and 2001
15.
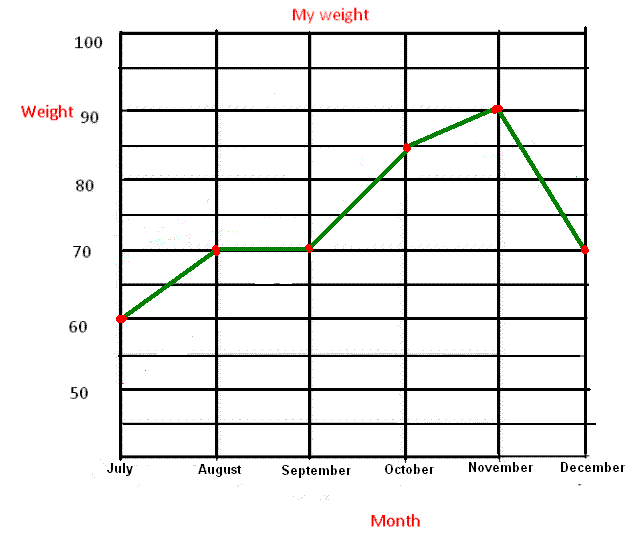
In which month was my weight the highest?
a)
July
b)
September
c)
November
d)
December
16.

When was my weight the lowest?
a)
July
b)
September
c)
November
d)
December
17.

Did the temperature increase or decrease between day 1 and day 2?
a)
increase
b)
decrease
18.
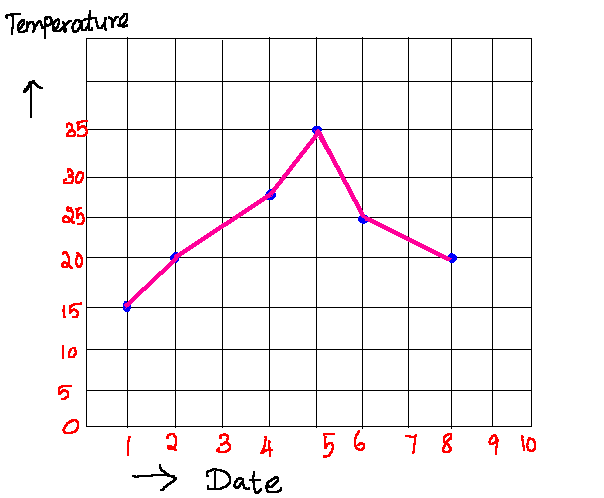
On which 2 days was the temperature the same?
a)
2 and 8
b)
1 and 6
c)
3 and 4
d)
5 and 8
19.
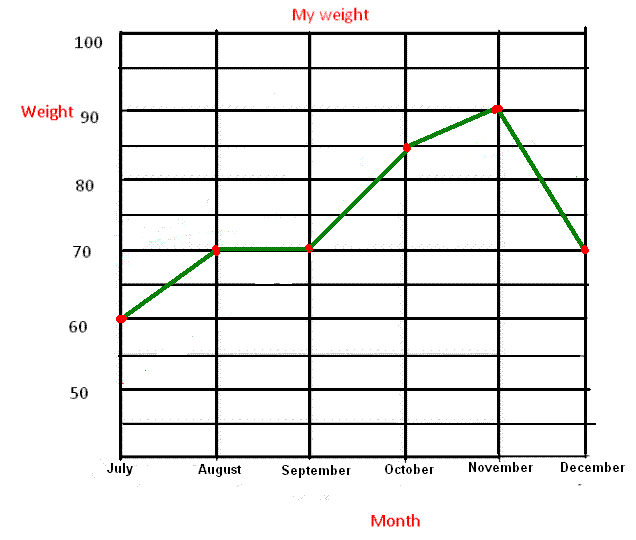
What was the overall trend on this graph?
a)
decreasing
b)
increasing
20.
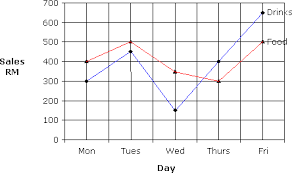
People buy more drinks on ____ than any other day.
a)
Monday
b)
Tuesday
c)
Thursday
d)
Friday
21.

What is the minimum value in the data shown on the line graph?
a)
70
b)
72
c)
91
d)
100
22.
Every graph must have a
a)
Pet
b)
Candy bar
c)
Title
d)
Chromebook
23.
What are the numbers called on the left side of a line graph?
a)
Cell Phone
b)
Graph
c)
Axis
d)
Scale
24.
If the numbers on the scale go from 0 to 20 by 2's, then by 2's is the
a)
Interval
b)
Graph
c)
Axis
d)
Categories
25.

What label is along the y-axis in this graph?
a)
Number of teams
b)
Smalltown teams
c)
Lines
d)
frequency table
100 %

