
 Worksheets
Graphs of Proportional Relationship
Total questions: 20
Worksheet time: 20mins

What does the point (0,0) represent in context of the situation?
No cookies were sold.
No money is made selling cookies.
No money is made when selling two cookies.
No cookies were sold and no money was made.

Which graph shows a proportional relationship between x and y?
F
G
H
J

Using the graph above, determine the constant of proportionality.
k = 0
k = 1
k = 3
k = 6

What does the point (2, 94) represent in this situation?
Every week, they earn $94.
After 94 weeks, they save $2.
After 1 week, they save $47.
After 2 weeks, they save $94.
Graph a proportional line
with a constant of 4
Graph a proportional line
with a constant of 2/4

Which statement below accurately represents the graph?
$100 is earned for each hour worked
$200 earned for every 2 hours worked
is the unit rate
$500 is earned for every 8 hours worked
$250 is earned after working 3 hours
What makes a graph proportional?
Straight Line
The line goes through (0,0)
Curvy line
Straight line and passes through (0,0)

True/False: The point (4 , 2) means that 4 cookies were purchased for $2.
True
False

Which of the following ordered pairs represents the unit rate?
(0.50, 1)
(2, 1)
(1, 0.50)
(1, 2)

What is the unit rate in this proportional relationship?
60 miles/1 hour
120 miles/ 2 hours
1 mile/ 1 hour

What does the coordinate (1,6) tell us in the context of this graph?
A sloth moves 1 foot every 6 minutes.
It takes a sloth 1 minute to move 6 feet.
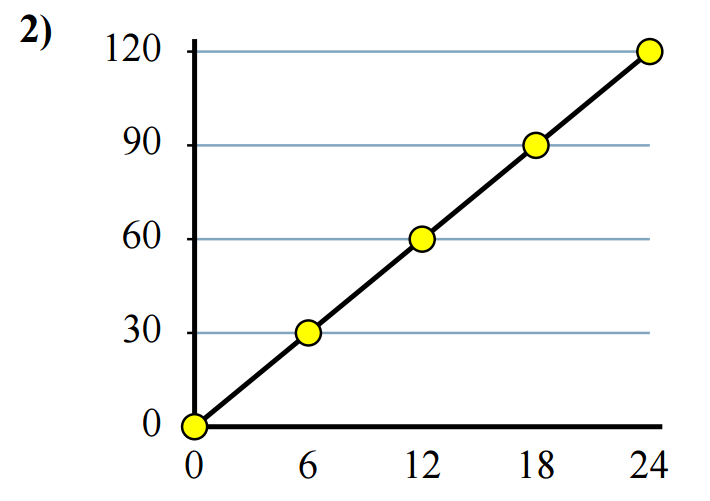
What is the constant of proportionality? Remember to simplify your answer.
k=5
k=6
k=30
k=1
k= 630

The graph shows the cost of buying gas at the gas station.
Is the number of gallons bought proportional to the cost?
Yes, it is a proportional relationship
No, this is not a proportional relationship

What does the point (10, 30) mean in the context of the situation?
10 times 3 is 30
10 gallons of gas costs $30
30 gallons of gas costs $10
(20, 60)

The graph shows the number of miles a car has driven over time.
Is the number of miles driven proportional to the amount of time? How do you know?
(a) , I know this because there (b) and (c)
Yes
is a straight line
it goes through the origin.
No
is a vertical line
it goes on the graph.
The graph shows the number of miles a car has driven over time.
What does the point (1, 50) mean in the context of the situation?
For every hour the car can travel 50 miles.
For every mile the car can travel for 50 miles.
The start of the graph.

The graph displays the cost to buy cookies at a local bakery.
What does the point (1, 0.50) mean in the context of the situation?
You purchased (a) cookie it cost (b)
$0.50
1
$1.00
The graph shows the number of miles a car has driven over time.
What does the point (5, 250) mean in the context of the situation?
To drive 5 miles it takes 250 hours.
In 5 hours a car can drive 250 miles.
The top of the graph.
The graph shows the number of miles a car has driven over time.
Identify the point on the graph that shows the unit rate.

