
 Worksheets
Data Tables and Graphs
Total questions: 20
Worksheet time: 20mins

How many more buckets of popcorn were sold on Saturday than on Sunday?
4
40
10
20

Based on the data in the table, how many students preferred blue and orange?
60
56
59
53
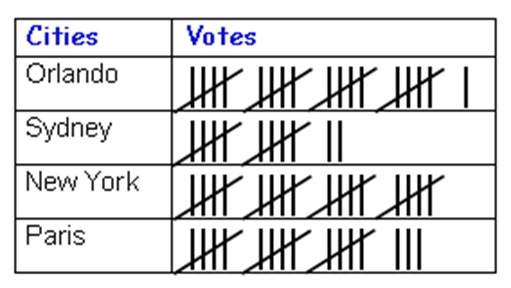
Which city had 21 votes?
Orlando
Sydney
New York
Paris

How many students' favorite color is blue?
11
12
14
17

How many more people like purple than red?
3
5
7
9

Alex and Joe used a double-bar graph to record the number of points they scored in their first two basketball games. What is the total number of points that both boys scored in both games?
20
22
26
44

What type of graph is this?
Bar Graph
Line Graph
Pictograph
Tally Chart

How many push-ups were done on Monday?
5
10
15
20

How many children participated in the survey?
34
30
32
6

F
G
H
J

Which table contains the values that satisfy the following function y=3x+1?
A
B
C
D

Select the equation that represents the data shown in the table.
y=x-6
y=x+3
y=x-3
y=x+6

Which table contains only values that satisfy the following:
y=21x
A
B
C
D

Look at the graphed line.
Which function table matches the line graphed.


Which function table matches the line graphed.


Which equation matches the table?
y = x + 5
y = 5x
y = x - 5
x = y - 5

Which equation matches the table?
y = x
y = 5x
y = x - 4
y = x + 4

Nancy can type 50 words per minute. Look at the table below to write an equation that matches the data.
m=50 + w
w= 50m
w= 50 + m
m= 50 - w

Which equation matches the table?
y = -2 + x
y = x + 3
y = x - 3
y = x - 2

What rule would explain this input output table?
The output is 3 times as much as the input.
The input is 3 times as much as the output.
The output is 8 times as much as the input.
The input is 8 times as much as the output.

