
 Worksheets
Analyzing Circle Graphs
Total questions: 20
Worksheet time: 20mins

Which bar graph is the same as the data in the circle graph if 20 people were surveyed?


Which circle graph has the same data as the bar graph?


Sixty people were surveyed about their favorite Candy. The results are show in the circle graph. Which bar graph is the same data?


Twenty people were surveyed about their favorite color. The information is shown in the circle graph. Which bar graph shows the same information.


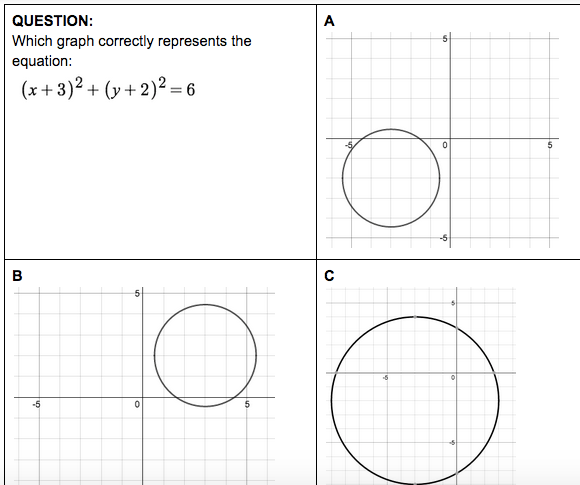
See Picture
A
B
C

Find the graph to this equation


What is the correct graph for the equation x²+y²=4?


Answer is in none of the given

Select the graph of the circle: (x−1)2+(y+2)2=25


Find the graph to this equation


Select the graph of the circle: (x−3)2+y2=4


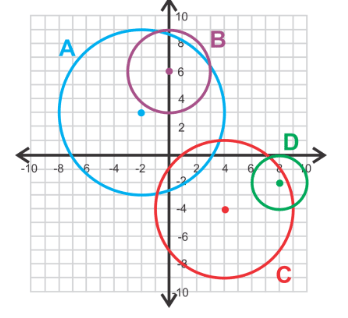
Which graph corresponds to
(x)2+ (y-6)2=9
A
B
C
D
Which graph corresponds to (x+2)2+ (y-3)2=36
A
B
C
D

Students were surveyed about their favorite sports to play in phys.ed. The results are represented in this circle graph. If 48 students were surveyed, how many chose soccer?
10
12
15
14

If there are 300 seventh graders, how many students prefer choir?
96
24
75
42

80 sixth grade students picked their favorite elective. Which is closest to the total number of students that picked band and choir?
80
4
40
20

Which circle graph best represents the same set of data as the bar graph?


Which bar graph matches the circle graph?

A) Option 1

B) Option 2

C) Option 3

D) Option 4

If 200 people were surveyed, approximately how many people like pepperoni and cheese as their topping?
100 people
150 people
50 people
75%

308 people were surveyed about how they got to school. How many ride their bike?
112 people
847 people
130 people
110 people

The circle graphs provided show how Doug and Fred spend their time after school.
What is the difference between the percent of time Doug spends playing sports and the percent of time Fred spends playing sports?
14%
10%
4%
1%

