
 Worksheets
Equation Line of Best Fit
Total questions: 20
Worksheet time: 20mins

Click on Image. Orange points are NOT necessarily data from the set.
y = 5/6 x + 1
y = x + 5/6
y = x + 1
y = 6/5 x + 1

Click on image. Orange points are NOT necessarily data from the set.
y = 5/8 x + 7
y = 8/5 x + 7
y = -5/8 x + 7
y = -8/5 x + 7

Click on Image. Orange points are NOT necessarily data from the set.
y = -8/9 x + 9
y = -9/8 x + 9
y = 8/9 x + 9
y = 9/8 x + 9

Click on Image. Orange points are NOT necessarily data from the set.
y = -x + 9
y = x + 9
y = -9x + 9
y = -9x + 1


The graph shows a line of best fit for data collected on the amount of income earned by lawn companies in relation to the number of yards mowed. What is the equation of the line of best fit?
y = (3/2) x
y = 30x
y = 30x + 300
y = (3/2)x + 300

What is the equation of the line of best fit?
y= −21x + 6
y= 21x +6
y= 6x + 2
y = -2x +6
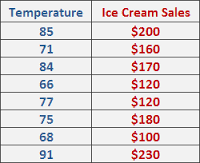
Find the equation of the line of best fit for the given data
y=163.41x+4.19
y=-163.41x+4.19
y=-4.19x+163.41
y= 4.19x+(-163.41)

The graph above shows a line of best fit for data collected on the distance bicyclists have remaining in relation to the amount of time they have been riding. What is the equation of the line of best fit?
y = -25x + 170
y = 25x + 170
y = -(5/8) x + 170
y = (5/8) x + 170

What is the equation of the line of best fit
y= -2x + 10
y= 10x+ 2
y= 10
Find the equation of the line of best fit for the given data
y = 163.41x+1.49
y =- 163.41x+ 4.19
y =- 4.19x+163.41
y = 4.19x -163.41

What is the equation of the line of best fit?
y = 5x + 25
y = x + 25
y = 25x + 1
y = 25x + 5

Is this line an accurate line estimate of best fit for the data?
Yes
No

What is the equation of the line of best fit?
y= 2x
y=3x+7
y= 21x +3
y= −21x −3

Is this line an accurate line estimate of best fit for the data?
Yes
No

The graph below shows the value of a computer given the age of the computer. Which equation would best fit the data?
y = -250x + 2000
y = 250x + 2000
y = -250x - 2000
y = 2000x -250

Click on Image. Blue points are NOT necessarily data from the set.
y = -3/4 x + 9
y = 3/4 x + 9
y = -4/3 + 9
y = -3/4 x - 9

Click on Image. Orange points are NOT necessarily data from the set.
y = 1/4 x + 5
y = 1/8 x + 5
y = 8x - 5
y = -1/4 x + 5

Click on Image. Orange points are NOT necessarily data from the set.
y = x + 1
y = -x + 1
y = 6x + 1
y = x + 6

Click on Image. Blue points are NOT necessarily data from the set.
y = -5/8 x + 9
y = 5/8 x + 9
y = -8/5 + 9
y = 8/5 - 9

