
NEW
Font size
 Worksheets
Line Graphs
Total questions: 20
Worksheet time: 20mins

What is the name of this graph?
line plot
line graph
bar graph
frequency table

What is the main purpose of a line graph?
to compare two things
to show trends over time
to have an independent variable
so you don't have to read words

What label is along the y-axis in this graph?
Copyright 2007
Lines
Age in Years
Number of Teens
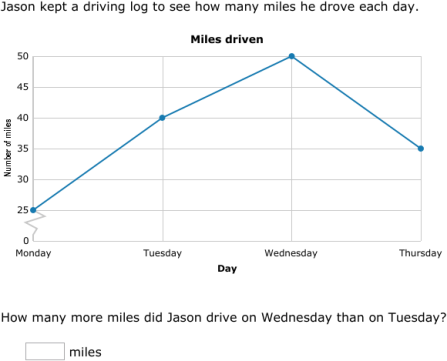
How many more miles did Jason drive on Wednesday than on Tuesday?
40 miles
10 miles
5 miles
50 miles
At which age do the least amount of teens have a cell phone?
18
14
13
15

How much does it cost to have your lawn mowed for 2 hours?
$16
$17
$18
$19

Use the line graph to answer the following question.
What is the difference between the lowest test score and the highest test score?
100
40
60
80

Use the line graph below to answer the following question.
Between what two days had the least change in temperature?
Between Sunday and Monday
Between Monday and Tuesday
Between Tuesday and Wednesday
Between Wednesday and Thursday

Use the line graph below to answer the following question.
Between what two days was there no temperature change?
Wednesday and Thursday
Monday and Tuesday
Tuesday and Wednesday
Thursday and Friday
What is the name of this graph?
line plot
line graph
bar graph
frequency table
What is the main purpose of a line graph?
to compare two things
to show trends over time
to have an independent variable
so you don't have to read words
What kind of graph shows change over time?
bar graph
line graph
line plot
pie graph

According to the graph, is the plant height increasing, decreasing, or staying the same?
Increasing
Decreasing
Staying the same

Which statement is true based on the information in the graph?
More time was spent on homework on Monday than Tuesday
No homework was completed on Friday
The same amount of time was spent on homework each night

Between which two days did the amount of minutes spent doing homework stay the same?
Monday to Tuesday
Tuesday to Wednesday
Wednesday to Thursday
Thursday to Friday

Which month did the restaurant sell 40 pizzas?
March
May
July
August

How many centimeters of rain fell on the third day?
2
3
4
7
How many use cellphones at the age of 17
341
590
430
530

When was the greatest amount of shoppers at the store?
10am
1pm
6pm
2pm

How many push-ups were done on Monday?
5
10
15
20

