
NEW
Font size
 Worksheets
Line Graphs
Total questions: 10
Worksheet time: 10mins

How many cars were sold on Saturday and Sunday?
5
3
8
10

How many students had more than 6 candy bars?
5
2
3
1
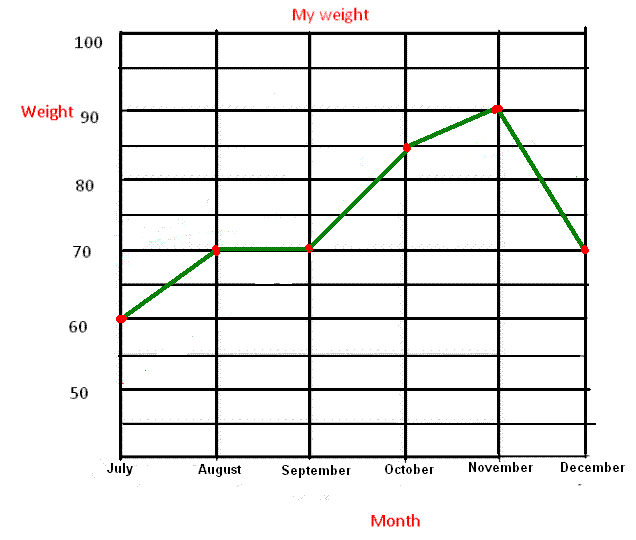
What was the overall trend on this graph?
decreasing
increasing
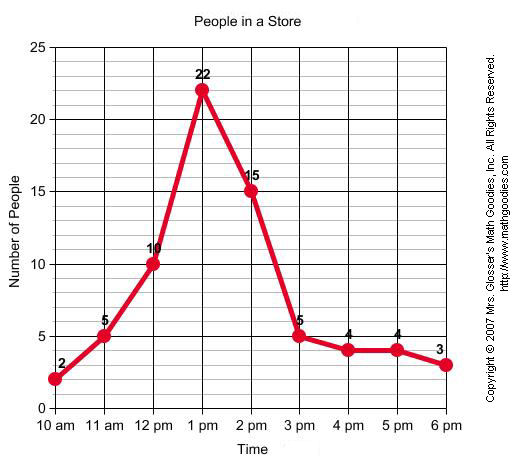
Between which two times was the greatest increase in number of shoppers?
12pm and 1pm
1pm and 2pm
2pm and 3pm
10am and 11am
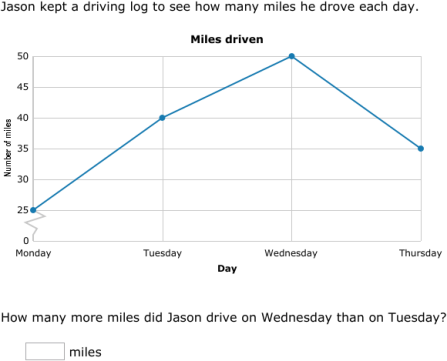
How many more miles did Jason drive on Wednesday than on Tuesday?
40 miles
10 miles
5 miles
50 miles

Between which two years did the bear population remain constant or the same?
2004 and 2005
2001 and 2002
2005 and 2006
2000 and 2001
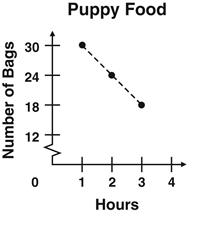
The number of bags of puppy food at a pet store decreases as the number of hours the store is open increases, as shown on the graph. At the fourth hour, how many bags of puppy food are left to sell?
10
12
15
18

Annie recorded the amount of rain that fell each day. The results are shown in the line graph below. How many centimeters of rain fell on the third day?
2
3
4
7
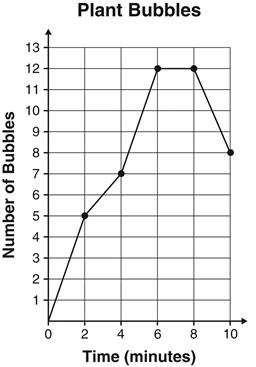
During an experiment, students counted the number of bubbles given off by water plants every 2 minutes during a 10-minute period. The results are graphed below.
At which two times were the same number of bubbles given off?
2 and 4 minutes
4 and 6 minutes
6 and 8 minutes
8 and 10 minutes

The graph shows the number of inches a plant grew each week.
Between which 2 weeks did the plant grow the MOST?
Week 1 and Week 2
Week 2 and Week 3
Week 3 and Week 4
Week 4 and Week 5

