
 Worksheets
Review of Exponential Functions
Total questions: 15
Worksheet time: 15mins
The population of Winnemucca, Nevada, can be modeled by P=6191(1.04)t where t is the number of years since 1990. What percent did the population increase each year?
4%
It doesn't say
I don't know
400%
You have inherited land that was purchased for $30,000 in 1960. The value of the land increased by approximately 5% per year. What is the approximate value of the land in the year 2011?
$344,022
$31,500
$15,000
$28,500
You drink a beverage with 120 mg of caffeine. Each hour, the caffeine in your system decreases by about 12%. How long until you have 10mg of caffeine?
19 to 20 hours
10 to 20 hours
15 to 16 hours
5 to 6 hours

Is the pictured graph growth, decay, or linear or none?
Exponential Growth
Exponential Decay
Linear
None
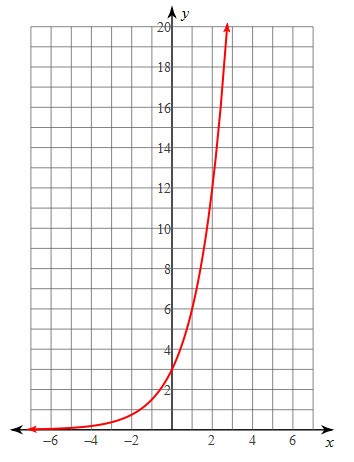
What is the y-intercept of the function?
2
3
1
-2
You invest $400 for 5 years and the interest rate is 4.29% each year.
y=400(1 - 0.0429)5
y=400(1+.0429)5
y=400(1+ 4.29)5
y=400e0.049*5
The value of a car is $15,000 and depreciates at a rate of 8% per year. What is the exponential equation?
y=8(15,000)x
y=15,000(1 + .08)x
y=15,000(1 - .08)x
y=15,000(0.08)x
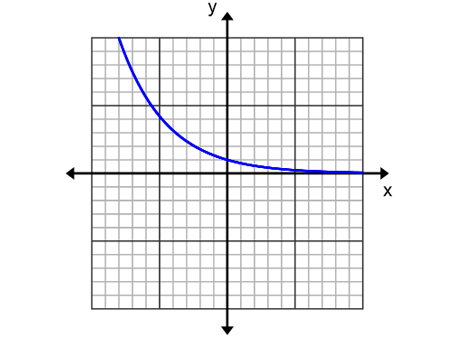
Is this exponential growth or decay?
Growth
Decay

What is the y -intercept of y=3(4)x?
1
0
4
3
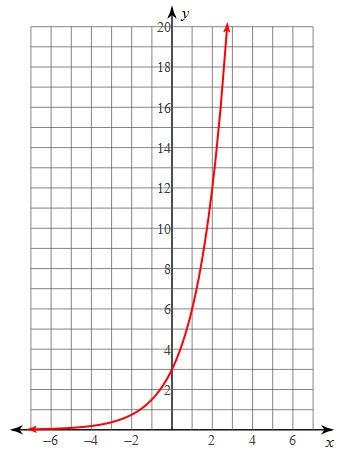
What is the y-intercept of the function?
2
3
1
-2

Which equation is represented by the table?
y=81(2)x
y=81(21)x
y=2x
y=2(2)x

What kind of equation is indicated by the pictured table?
Exponential Decay
Exponential Growth
Linear Decay
Linear Growth

The pictured graph shows...
Exponential Growth
Exponential Decay
Linear Growth
Linear Decay
Exponential functions are the result of
Repeated Multiplication
Repeated Addition

