
 Worksheets
Graphs with Proportional and Non Proportional Grids
Total questions: 15
Worksheet time: 15mins

Does the table show a proportional relationship?
Yes
No
Proportional or Non-Proportional:
The graph does not pass through the origin.
Proportional
Non-Proportional

Which of the following sets of ordered pairs represents a proportional relationship?
<(0, 5)(1, 10)(2, 15) (3, 20)>
<(3, 15)(5, 25)(8, 40) (12, 60)>
<(4, 6)(8, 6)(2, 6)(5, 6)>
<(3, 6)(4, 8)(5, 10) (3, 12)>
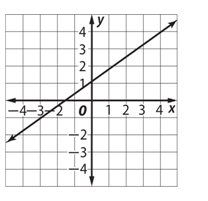
What is the y-intercept for the following graph and is it proportional or non-proportional?
Proportional, b=1
Proportional, b=-2
Non-proportional, m= -1
Non-proportional, b=1
Which equation shows a NON-proportional relationship of x and y?
y = 5x
y = 2.5x
y = x + 3
y = 1/2x

The graph shown is:
A linear function but non proportional
Not a function because it is not a straight line.
Proportional because it goes through the origin.
A function but not linear or proportional.

Which statement best describes the relationship of x and y in the table?
Proportional
Not Proportional
What are the main characteristics of a proportional relationship between two variables?
They pass through the origin.
They are linear and also pass through the origin.
They are curved
They have a negative relationship and pass through the origin.
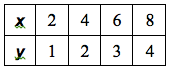
Does the table represent a proportional relationship?
Yes.
No.
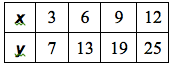
Does the table represent a proportional relationship?
Yes.
No.
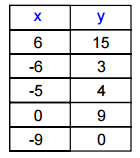
Does the table show a proportional relationship?
Yes
No

Does the equation show a proportional relationship?
Yes
No

Does the equation show a proportional relationship?
Yes
No

Is the graph proportional or non proportional?
[Es el gráfico proporcional o no proporcional?]
[Il grafico è proporzionale o non proporzionale?}
Proportional
Non Proportional

Is the graph proportional or non proportional?
[Es el gráfico proporcional o no proporcional?]
[Il grafico è proporzionale o non proporzionale?}
Proportional
Non Proportional

