
 Worksheets
Proportional Relationships with Graphs
Total questions: 14
Worksheet time: 14mins

Why does this graph show a non-proportional relationship?
Because it is proportional
It goes through the origin
It does not go through the origin
It is a straight line
A proportional relationship can be written as an equation in the form ____ = _____ _____
y = k+x
y = k-x
y = kx
y = k/x
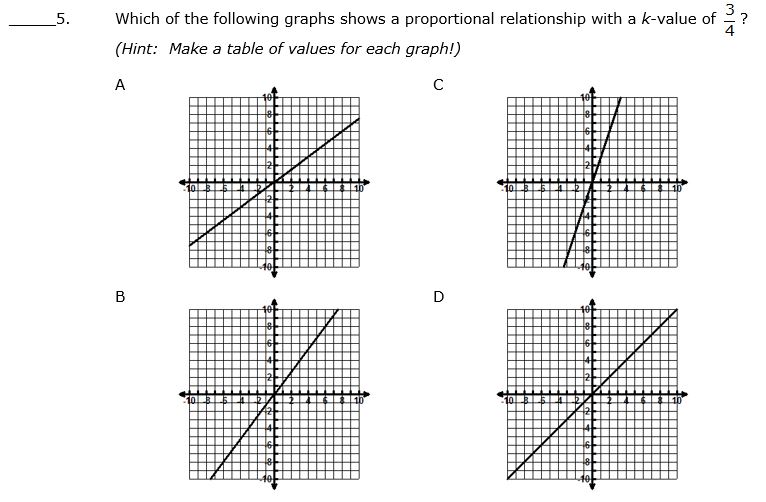
Which graph is proportional?
A
B
C and D
All of the graphs are proportional

Is the graph proportional or non proportional?
proportional
non proportional

Why does this graph show a non-proportional relationship?
Because it is proportional
It goes through the origin
It does not go through the origin
It is a straight line

REVIEW QUESTION
Is this table proportional or non-proportional?
Proportional
Non-Proportional
both
neither

What is the constant of proportionality?
$3
$4
$2
$9
What makes a graph proportional?
It is a straight line.
It goes through the origin.
It does not go through the origin.
If it goes down instead of up.

What is the unit rate for the table?
$1 / 3 watermelon
$3 / 1 watermelon
1/3 watermelon / pound
$0.33 / 1 watermelon
Which graph is proportional?


What is a way I can tell if a table is proportional?
x y is equivalent (the same) for all points
It goes through the origin
The line goes up.
You can't.

Is this graph proportional?
Yes
No

Which equation would math this proportional relationship?
y = 45x
y = 15x
y = 30x
y = 20x

Does the following table represent a proportional relationship? If so identify the constant of proportional and create an equation to represent it.
Proportional; k = 1/40 pages per day; y=1/40x
Proportional; k = 40 pages per day; y=40x
Not Proportional
Proportional; k = 40 days per pages; y=40x

