
 Worksheets
Shape, Center, and Spread Basics
Total questions: 20
Worksheet time: 20mins
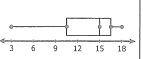
Which of the following best describes the shape of the distribution?
skewed left
skewed right
uniform
symmetrical
Should we use the mean or the median to represent the center of the data?
(a)
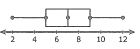
Which of the following best describes the shape of the distribution?
skewed left
skewed right
uniform
symmetrical
Given that the data is symmetric, which pair of measures should be used to represent the data?
center: median
spread: standard deviation
center: mean
spread: IQR
center: mean
spread: standard deviation
center: median
spread: IQR

Which summary statistic should be used to compare the two data sets and why?
The median and the interquartile range because they are normally distributed.
The median and the interquartile range because they are skewed.
The mean and the standard deviation because they are normally distributed.
The mean and the standard deviation because they are skewed.

Which measure of spread should be used to describe the distribution?
standard deviation
interquartile range
range
median

Which describes the shape of the distribution?
skewed right
skewed left
symmetric
uniform

Which measure of center will be the smallest?
(Remember which one pulls toward the tail)
median
mean
mode

Describe the shape of the graph.
skewed
symmetrical
uniform

What is the shape of the distribution?
symmetric
uniform
skewed to the right
skewed to the left

Because this distribution is ____________ to the ___________, we would use the ______________ for the center and the _____________ for the spread of the data.
symmetric, middle, median, IQR
skewed, left, median, IQR
skewed, left, mean, IQR
skewed, right, median, standard deviation

What is the shape of the data shown?
Skewed left
Skewed Right
Symmetric
Bell shaped

The dot plots show the gas mileage, in miles per gallon, for several cars and SUV's. Which type of vehicle has a larger spread?
cars
SUVs

What is the shape of the data?
symmetrical
skewed left
skewed right
uniform

Which of the following best describes the shape of the distribution?
skewed left
skewed right
uniform
symmetrical

Find the IQR of the distribution.
(only type in the number)
(a)
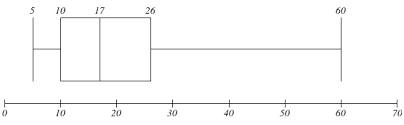
This distribution is skewed to the (a) .

Find the interquartile range?
8
6
5
4

Which distribution has a larger Interquartile Range?
(a)

Which distribution has the largest median?
(a)

