
 Worksheets
Distance Versus Time Graph
Total questions: 22
Worksheet time: 2hrs 50mins


What is happening at B?
Stationary
Accelerating
Slower steady speed; positive velocity
Steady speed; negative velocity




from 3rd second to 5th second, the object is
moving at a constant speed
speeding up
not moving
slowing down
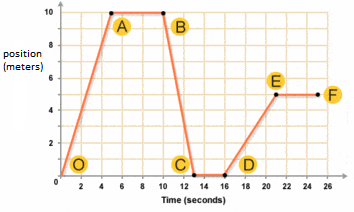
What is happening in this graph from point B to C?
The object is going down a hill.
The object is returning to its starting location.
The object is slowing down.
The object is staying still.
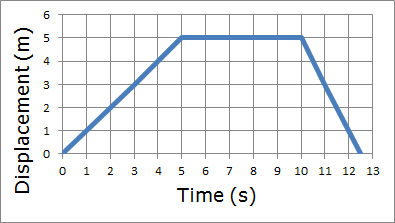
According to the graph how far does the person travel in the first 5 seconds?
2 m
10 m
0 m
5 m


What is the object's velocity at 3 seconds? Use slope
+3 m
+5 m
+5 m/s
+1 m/s

What is the total distance that the object moved at 45 seconds?
7 m
13 m
.16 m
6.4 m
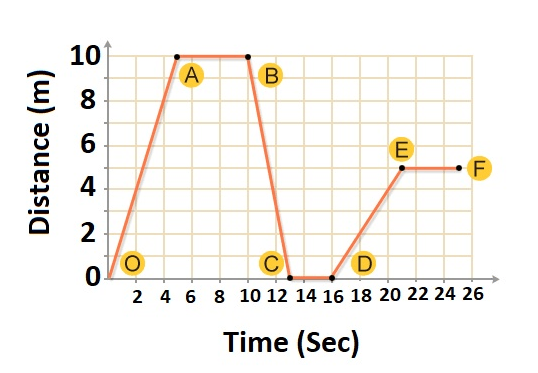
What is the total displacement traveled by this object?
5 m
20 m
25 m
.19 m
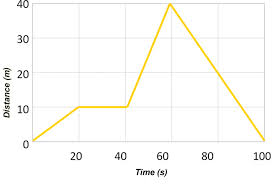
How long did it take this object to travel back to its reference/starting point?
20 s
30 s
60 s
100 s

Negative velocity means an object is…
Speeding up
Slowing down
Moving forward to the positive vector
Moving towards the negative vector

What is the displacement on this graph?
-20 m
20 m
0 m
100 m

What is the total velocity of this graph
-0.2 m/s
0.2 m/s
-1 m/s
1 m/s

What is the total speed for this graph?
0 m/s
0.67 m/s
1.5 m/s
2.0 m/s

What is the velocity from A to B? Use slope and don't forget direction.
2 m/s
-2 m/s
1.5 m/s
-1.5 m/s

