
 Worksheets
Graph Questions
Total questions: 20
Worksheet time: 15mins
Name
Class
Date
1.

What type of graph is this?
a)
Line Graph
b)
Pictograph
c)
Bar Graph
d)
Histogram
2.

What type of graph is this?
a)
Line Graph
b)
Pictograph
c)
Bar Graph
d)
Histogram
3.

What is the title of this graph?
a)
Sports
b)
Our Favorite Sports
c)
Bar Graph
d)
Number of Students
4.

Which type of graph is this?
a)
Histogram
b)
Bar Graph
c)
Stem Plot
d)
Box Plot
5.

What type of graph is this?
a)
Bar graph
b)
Histogram
c)
Pie Chart
d)
Stem Chart
6.

A pie chart allows you to easily see
a)
information about the proportion of parts relative to the whole.
b)
the total number of each category.
c)
how much data occurs within a range of numbers.
d)
the spread of the data.
7.

How many more people like purple than red?
a)
3
b)
5
c)
7
d)
9
8.

How many students have blue for a favorite color?
a)
11
b)
12
c)
14
d)
17
9.

How many students take the bus to school?
a)
35
b)
20
c)
10
d)
15
10.
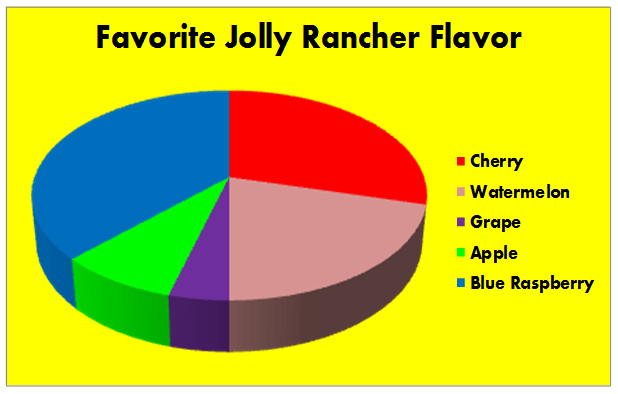
According to this graph, what is the most popular flavor of Jolly Rancher?
a)
Cherry
b)
Grape
c)
Blue Raspberry
d)
Watermelon
11.

308 people were surveyed about how they got to school. How many ride their bike?
a)
112 people
b)
847 people
c)
130 people
d)
110 people
12.

What percent of people chose gummy bears as their favorite candy?
a)
25%
b)
15%
c)
30%
d)
None of these
13.

The team scored 50 points. How many points did Kendrick score?
a)
12 points
b)
20 points
c)
10 points
d)
72 points
14.
What graph is used to see the percentage in the groups? (aka the percentage of the whole)
a)
Line Chart
b)
Bar Graph
c)
Pie Chart
d)
Column Chart
15.
The __ - axis is vertical in the coordinate plane.
a)
X
b)
Y
c)
Z
d)
None of the above
16.
The __ - axis is the horizontal axis of the coordinate plane.
a)
X
b)
Y
c)
Z
d)
None of the above
17.

People buy more drinks on ____ than any other day.
a)
Monday
b)
Tuesday
c)
Thursday
d)
Friday
18.

Which type of graph shows change over time?
a)
bar graph
b)
line graph
c)
circle graph
19.

How many students spent 7 hours doing homework that week?
a)
1
b)
3
c)
5
d)
6
20.

What is this graph missing?
a)
Axes
b)
Title
c)
Categories
d)
None of these
100 %

