
NEW
Font size
 Worksheets
Motion Graph Scenario
Total questions: 19
Worksheet time: 44mins

What is the speed of this object?
constant speed
not moving
speed is increasing
speed increasing at a constant rate

What happened from point A to point B?
not moving
increasing speed at a constant rate
moving at a constant speed
moving at 10 m/s2 acceleration

Which line(s) represent(s) constant acceleration?
A
B and D
C
A, B, and D

Which part of the line shows constant POSITION?
E to F
C to D
all of above
A to B


How many times does this object STOP moving (stay at rest for multiple seconds)?
None
Once
Twice
Three times

How long (after first leaving) did it take this object to travel 10 m?
0 s
10 s
15 s
20 s
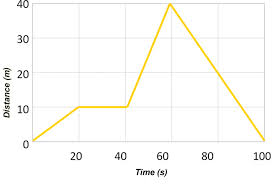
How long (after it first left) did it take this object to travel back to its reference/starting point?
20 s
30 s
60 s
100 s


During the segment between 50 seconds and 70 seconds, which direction was Tom moving?
Tom was moving back towards his house
Tom was moving down a hill
Tom was moving towards the bus stop
Tom was not moving

Which line(s) show(s) slowing down during the whole time?
orange and green
blue and pink
just orange
just green

Which line(s) show(s) a change in direction?
Green only
Blue and red
orange and pink
green and pink

Which line(s) show(s) positive velocity and negative acceleration for at least some part of the time?
pink, blue and red
green and orange
only orange
only pink

What would the d-t graph look like for an object travelling at a constant velocity?
Horizontal line
Straight diagonal line
Curved line

Which object is moving faster?
A
B
They have the same speed.


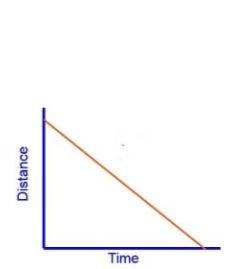
What is this line of this graph showing?
moving away from starting point at a constant speed
moving back towards the starting point at a constant speed
acceleration (getting faster)
deceleration (getting slower)


