
 Worksheets
Interpreting Graphs Science
Total questions: 15
Worksheet time: 18mins

What conclusions can you draw from this graph?
The deer population went down over time.
The deer population went up over time.
The dear population went up quickly, then down, but then stayed the same.

What conclusion can be made from this graph?
The gummy bear did not change mass after 24 hours of being submerged in water.
The gummy bear grew the longest in length after being submerged in vinegar.
Gummy bears change color when they are submerged in different liquids.

Name a controlled variable (constant) for this experiment.
the type of solution in each container
The amount of solution used in each container
the length of the gummy bear after it was submerged

What is the independent variable of this experiment based on this graph?
the color of the gummy bear
the different types of solutions used to submerge the gummy bears.
the length of the gummy bears after they were submerged in different liquids

What is the difference in growth between the gummy bear that grew the least and the gummy bear that grew the most?
2 inches
5 inches
3 inches
1 inch

Which biome is the largest?
Savanna
Boreal Forest
Tropical Rainforest
Desert

T8 - What does this graph show?
Number of bacteria on your skin.
How different bacteria cultures grow over time
Type of Bacteria
What do we use to pick the numbers for the scale?
you don't need a scale
you must always count by tens
use the data range to help you decide on a scale

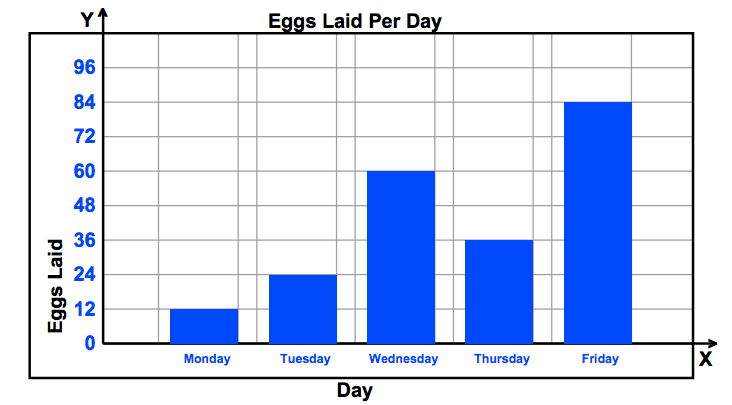
How many more eggs were laid on Friday than Wednesday?
84
36
24
60

How many worms were found to be 7.0 cm long?
12
4
5
6

The purpose of this study was to discover
Does water depth affect temperature?
Does water depth affect the number of fish?
Does temperature affect the water depth?

Which point or points on the scatterplot are considered outliers?
A, C
B, D
B
A

What is the correlation?
Positive Correlation
Negative Correlation
No Correlation
There is not enough data
What is the dependent variable for this graph?
None
The deer population size.
Time
Number of hunters

