
 Worksheets
As Kinetics Maxwell Boltzmann
Total questions: 25
Worksheet time: 6hrs 15mins

The Maxwell–Boltzmann distribution of molecular energies in a sample of gas at a fixed temperature is shown.
Which letter represents the mean energy of the molecules?
A
B
C
D

The diagram shows the Maxwell−Boltzmann distribution of molecular energies in a gas at two different temperatures.
Which letter represents the most probable energy of the molecules at the higher temperature?
A
B
C
D

The question below is about the Maxwell–Boltzmann distribution shown for a sample of a gas, X, at two different temperatures.
Which letter shows the mean energy of the molecules at the higher temperature?
P
Q
R
S

The question below is about the Maxwell–Boltzmann distribution shown for a sample of a gas, X, at two different temperatures.
Which statement is correct for the higher temperature?
The area under the curve to the left of Ea decreases.
The total area under the curve increases.
The activation energy decreases.
More molecules have the mean energy.

This question is about the Maxwell–Boltzmann distribution of molecular energies in a sample of a gas shown in the figure below.
Which letter best represents the mean energy of the molecules?
A
B
C
D
This question is about the Maxwell–Boltzmann distribution of molecular energies in a sample of a gas shown in the figure below.
What does the area under the curve represent?
The total energy of the particles.
The total number of particles.
The number of particles that can react with each other.
The total number of particles that have activation energy.

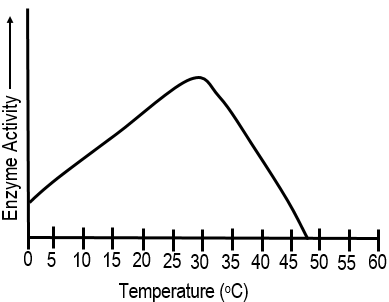
The graph shows how the activity of an enzyme change at different temperatures. Which statement BEST describes what happens to the enzyme when the temperature of the reaction increases to 63 degrees?
The enzyme is used up and the reaction stops.
The enzyme begins to decrease the rate of the reaction.
The enzyme continues to increase the rate of the reaction.
The enzyme changes shape and can no longer speed up the reaction.


The question below is about the Maxwell–Boltzmann distribution shown for a sample of a gas, X, at two different temperatures.
Which statement is correct for the higher temperature?
The area under the curve to the left of Ea decreases.
The total area under the curve increases.
The activation energy decreases.
More molecules have the mean energy.

The graph shows the Maxwell−Boltzmann distribution of molecular energies in a sample of gas at a fixed temperature.
The horizontal axis label is
energy
J mol−1
E
mean energy

The following figure shows the Maxwell.Boltzmann distribution of molecular energies in a sample of gas at temperature T.
Which of the following, A, B or C, describes what the value of Y represents in the figure?
A The energy needed for a successful collision
B The minimum energy needed for a reaction to occur
C The most probable energy
A
B
C

Which graph would be for the hottest object
Blue
Green
Red
If the three curves are Helium (Mass 4), Oxygen (Mass 32) and Chlorine (Mass 71), which curve would be Oxygen?
Blue
Green
Red

The green graph shows the Boltzmann distribution for a gas in a container before a change and the read graph shows the distribution after a change. Which of the following describes what happened?
The gas molecules heated up only
The gas molecules cooled down only
The gas cooled down and some molecules leaked out.
The gas heated up and some molecules leaked out.
Which unit is correct for the rate of reaction?
g mol-1
g min-1
mol dm-3
kJ mol-1
What is the meaning of the rate of reaction?
Decrease in amount of product
Decrease in amount of product against time
Increase in amount of products against time
Increase in amount of reactants against time

