
NEW
Font size
 Worksheets
Motion Speed Distance vs Time Graphs Review
Total questions: 15
Worksheet time: 15mins

Examine the distance vs. time graph below and determine which of the following statements best describes the motion displayed on the graph.
The object is moving away from the starting point at a constant speed.
The object is increasing in speed.
The object is not moving.
The object is decreasing in speed.

The graphs show the distance and time traveled by objects x and y. What statement are correct about the two objects?
Neither object is traveling at a constant speed and object x is traveling slower than object y.
Both are traveling at a constant speed but object x is traveling faster than object y.
Objects x and y are traveling at the same speed.
Objects x and y are speeding up over time.

Which object is traveling the fastest in the graph?
race car
cruising jet
flying eagle
galloping horse

What is speed?
How far you go
How fast you accelerate
How much distance is covered over a period of time
The change in location of an object.

The distance-time graph below represents the motion of a cart initially moving forward along a straight line.
*During which interval is the cart moving forward at constant speed?
Between points A and B
Between points B and C
Between points C and D
Between points D and E

Lucy the Llama ran 50 meters in 10 seconds. What is Lucy's speed?
50 meters
5 meters per second
1 second per meter
10 seconds

Refer to the velocity - time graph of a fast moving car below. At what time did the car reverse direction?
at 2 seconds
at 4 seconds
at 6 seconds
at 7 seconds
Deb walked to the ice cream shop. Sat and ate her ice cream and then went for a run.
Which graph matches this motion?
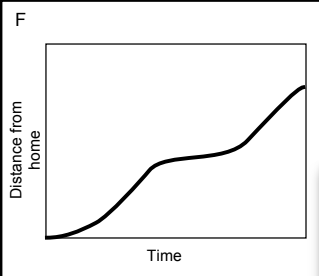
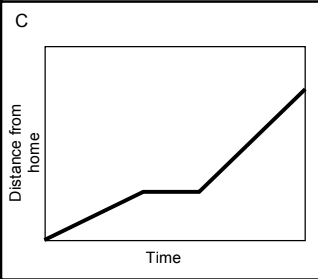
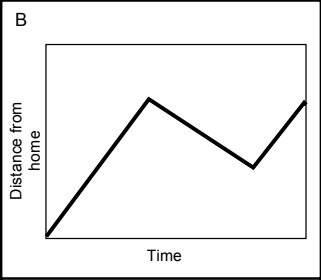
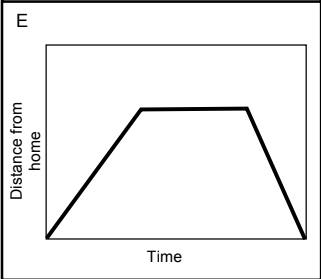

What is happening at A?
Stationary
Accelerating
Slower steady speed; moving away from the starting position
Steady speed; returning to start position

Which runner had a head start?
A
B
C

At what time did runner A pass runner B?
0 seconds
1 second
2 seconds
3 seconds

Which section of the graph shows decreasing velocity?
CD
DE
EF
GH
Which of the following distance vs. time graphs represents an object moving at a constant speed?
A graph with a straight line sloping upwards
A graph with a curved line
A graph with a horizontal line
A graph with a straight line sloping downwards
If a car accelerates uniformly from rest, which of the following speed vs. time graphs correctly represents this motion?
A graph with a straight line sloping upwards from the origin
A graph with a horizontal line
A graph with a straight line sloping downwards
A graph with a curved line starting from the origin
In a distance vs. time graph, what does a horizontal line indicate about the motion of the object?
The object is moving at a constant speed
The object is accelerating
The object is at rest
The object is moving backwards

