
 Worksheets
Mathematics 7 Third Quarter Exam
Total questions: 50
Worksheet time: 50mins
Which of the following is a method of sampling that involves selecting individuals based on their availability?
Convenience sampling
Random sampling
Stratified sampling
Systematic sampling
Why is it important for a certain school to use stratified sampling when surveying students about their favorite extracurricular activities?
It simplifies the data collection process.
It guarantees that the survey results will be accurate.
It ensures that every student has an equal chance of being selected.
It ensures that specific groups within the student body such as grade levels or clubs are adequately represented.
A certain barangay decides to survey every 5th household listed in their list of households database starting from a random point, what type of sampling technique are they using?
Cluster sampling
Convenience sampling
Stratified sampling
Systematic sampling
After conducting a survey, the SSLG finds that 70% of students prefer sports activities, while only 15% prefer arts and 15% prefer academic clubs. What can be concluded from this data regarding student preferences?
The survey was biased towards sports activities.
Students are not interested in arts or academic clubs.
The majority of students have a strong preference for sports over other activities.
All students enjoy participating in extracurricular activities equally with other members.
What is the purpose of a frequency distribution table?
To calculate averages
To display data visually
To summarize qualitative data
To organize data and show how often each value occurs

From the results, which of the following describes an interval of 2 hours?
0-1
0-2
2-5
7-10

How many respondents spent between 3 and 4 hours on recreational activities?
9
10
11
12

After creating a frequency distribution table from the survey data, which interval has the highest frequency?
0-2 hours
3-4 hours
5-6 hours
7-8 hours

If the local community center wants to encourage more recreational activities among residents who spend less than 5 hours, what conclusion can be drawn from the frequency distribution table?
Most residents are already active.
The survey was biased towards inactive individuals.
All residents are satisfied with their current activity levels.
There is potential for increasing participation among those who spend fewer than five hours.

What type of graph best represents the proportion of students who prefer each type of music?
Bar graph
Line graph
Pie chart
Stem-and-leaf plot

If you want to use bar graph to represent the survey data, how high would the bar for Hip-Hop be?
5 units
8 units
9 units
10 units

In a frequency distribution table, which of the following correctly represents the frequency for Rock?
8
5
10
15

Which music genre would occupy the largest section using a pie chart?
Classical
Jazz
Pop
Rock

If the school wants to promote music events based on student preferences, which of the following conclusions can be drawn?
The survey results indicate that Jazz is equally popular as Pop.
The school should eliminate all other genres except Rock and Pop.
The school should focus on organizing events for all genres equally.
The school should prioritize Pop music events since it is the most popular among students.
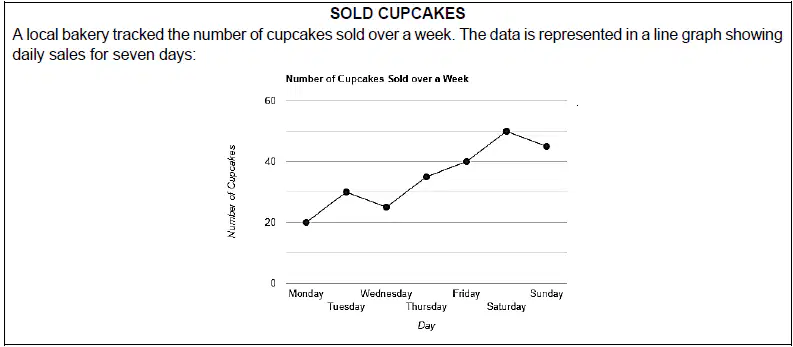
What does the line graph represent in the situation?
The profits made from cupcake sales
The daily sales of cupcakes over a week
The total number of cupcakes sold in a month
The types of cupcakes available at the bakery
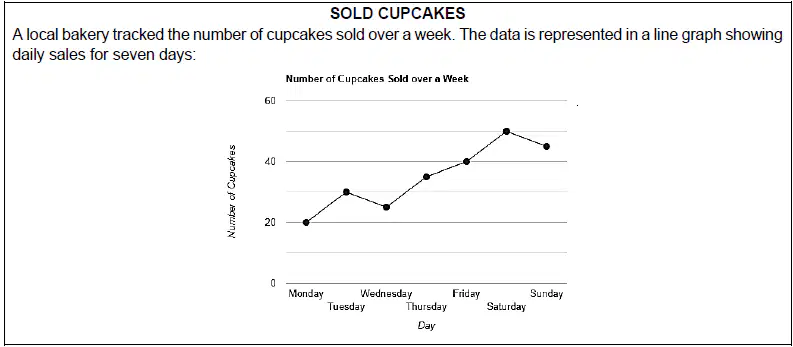
On which day did the bakery sell the most cupcakes?
Friday
Saturday
Sunday
Wednesday
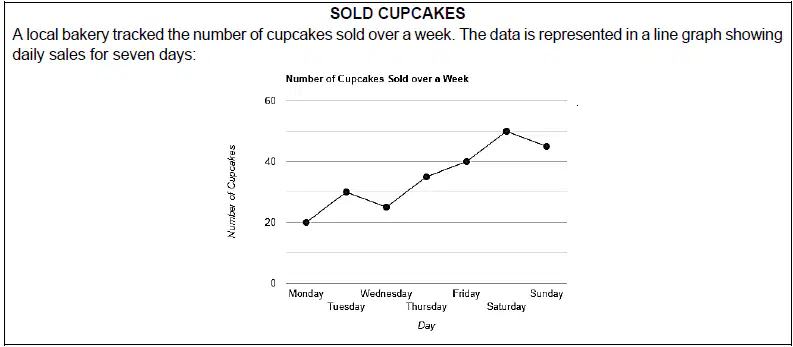
If the bakery wants to predict sales for the next week based on this data, what trend can be observed from the line graph?
Sales remain constant every day.
Sales are consistently decreasing.
Sales fluctuate randomly each day.
Sales generally increase throughout the week.
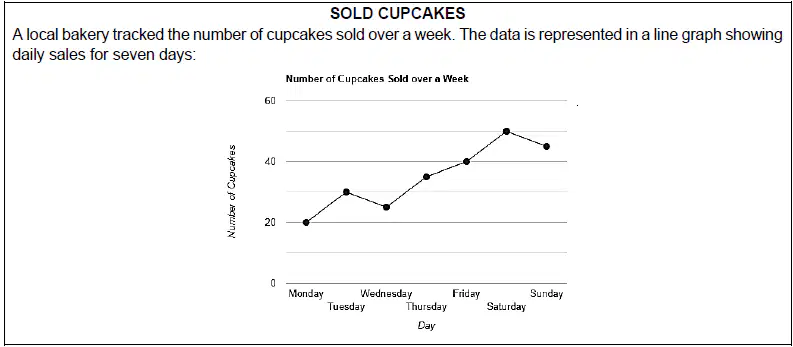
How many more cupcakes were sold on Friday compared to Monday?
10
15
20
25
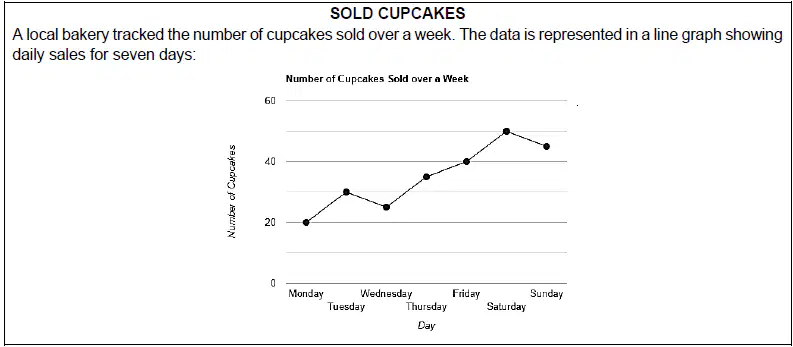
Based on the sales data, what recommendation can be given regarding inventory for next weekend?
Reduce inventory since sales are decreasing.
Maintain current inventory as sales are stable.
Focus only on weekday sales since they are lower.
Increase inventory to prepare for higher sales on weekends.
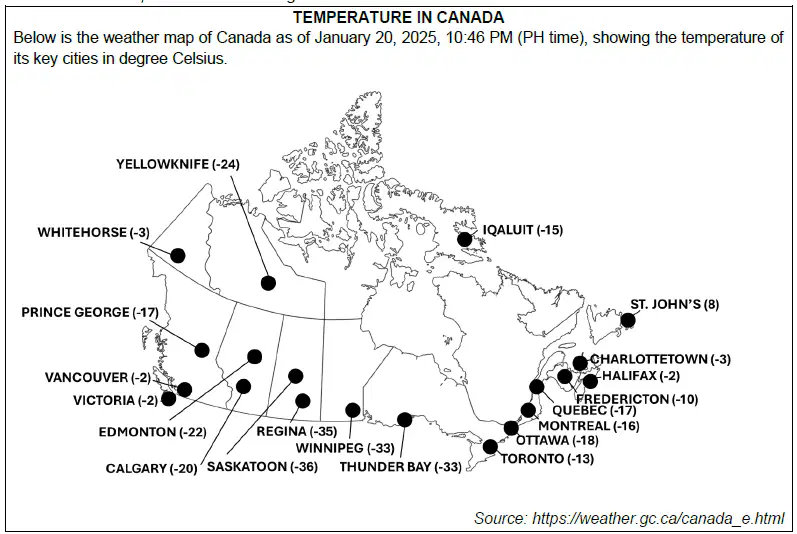
Which of the following cities represents the lowest temperature?
Calgary
Charlottetown
Saskatoon
Toronto
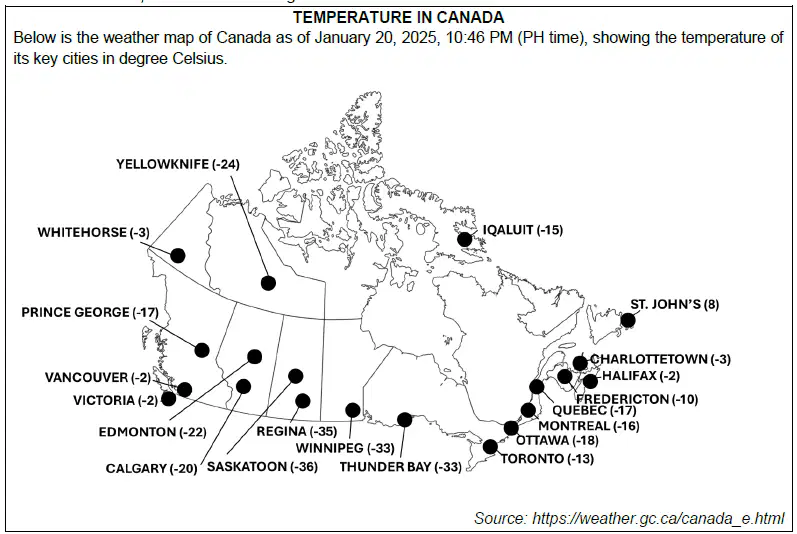
Based on the recorded temperatures, which city had the highest temperature?
Regina
St. John’s
Whitehorse
Yellowknife
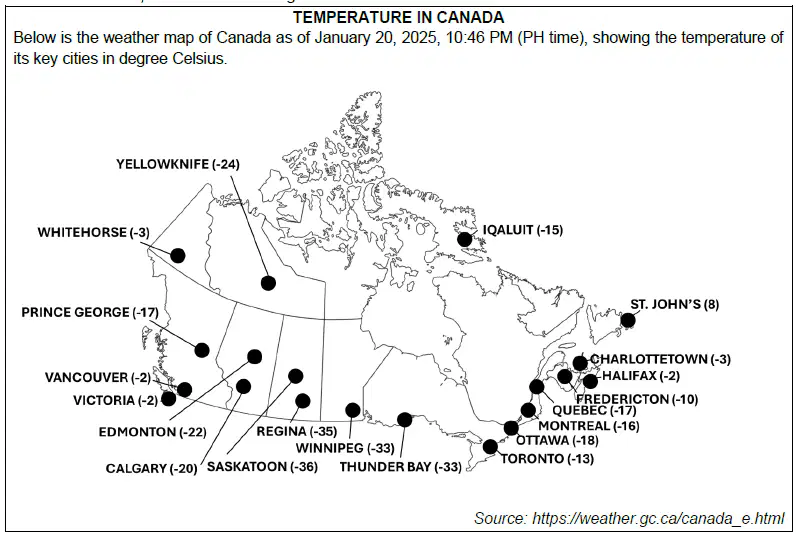
How many cities had temperatures below zero degrees Celsius?
17
18
19
20
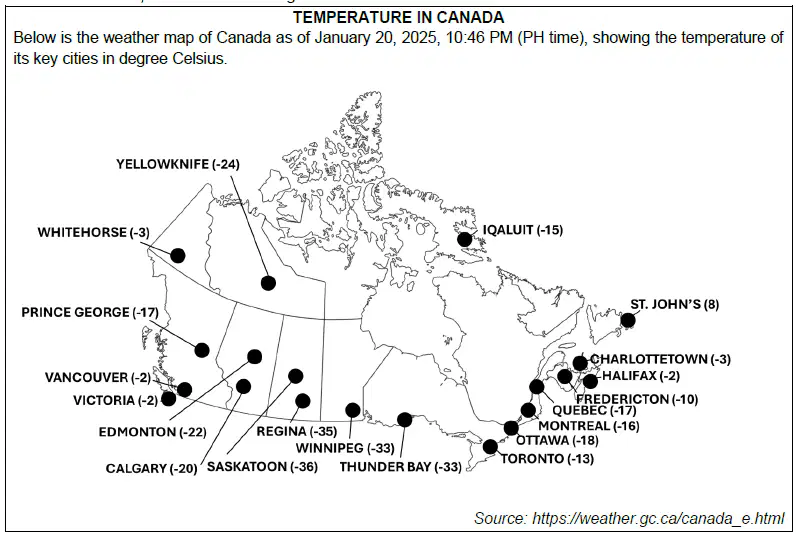
If the temperatures are represented on a number line, which of the following statements is true?
All temperatures are negative integers, except for one.
All temperatures are positive integers, except for three.
There are no negative integers represented in this data set.
The lowest temperature is closer to zero than the highest temperature.

What does a negative elevation indicate in this situation?
The hiker is at sea level.
The hiker is on flat ground.
The hiker is below sea level.
The hiker is at a higher altitude than sea level.
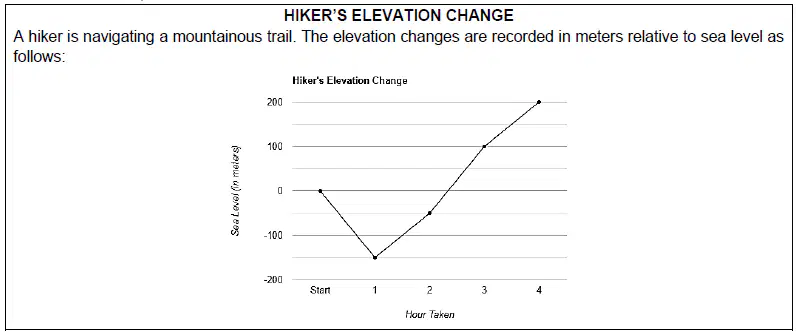
How much did the hiker go up from the second hour to the third hour?
25 meters
50 meters
100 meters
150 meters
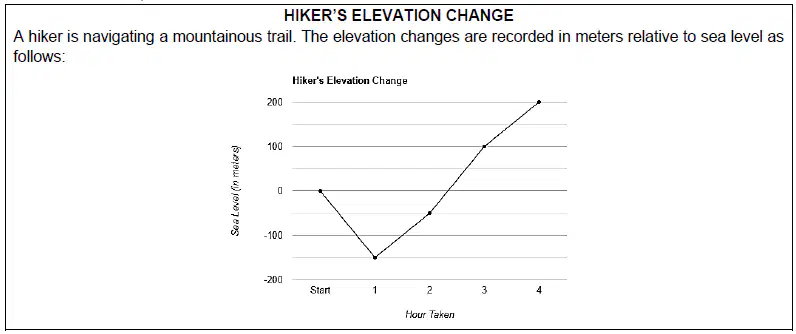
If the hiker continues to go up at the same rate from third to fourth hour, how high will he be after the fifth hour?
200 meters
250 meters
300 meters
350 meters
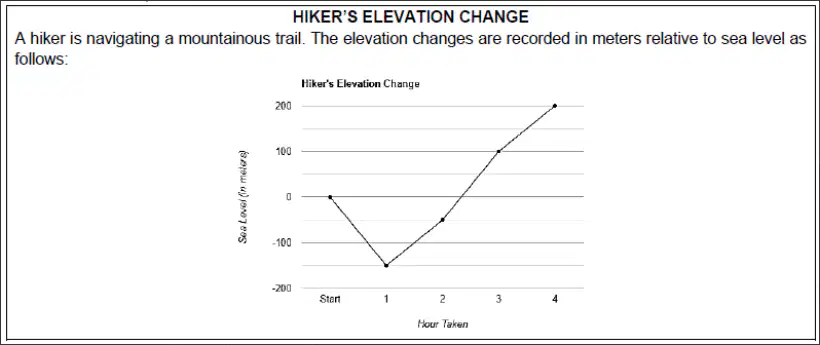
Considering the entire journey, what can be concluded about the hiker's overall change in elevation from the starting point after four hours?
The hiker has ascended a total of 200 meters.
The hiker has descended a total of 200 meters.
The hiker has an overall elevation gain of 200 meters from sea level.
The hiker fluctuated between above and below sea level but ended up at sea level.
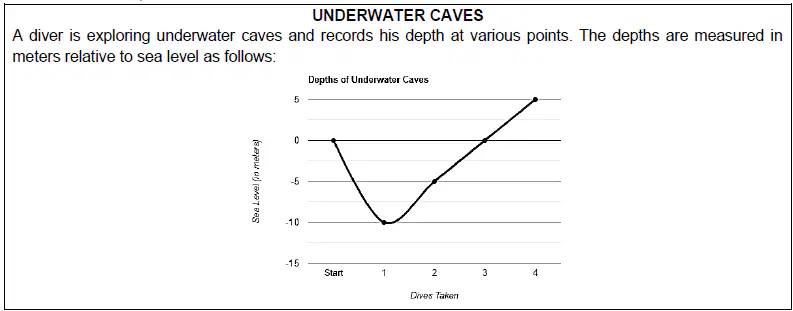
What integer represents the diver's position at sea level?
-10
-5
0
5

How deep does the diver reach if he goes down another 3 meters after the second dive?
12 meters below sea level
8 meters below sea level
5 meters below sea level
2 meters below sea level
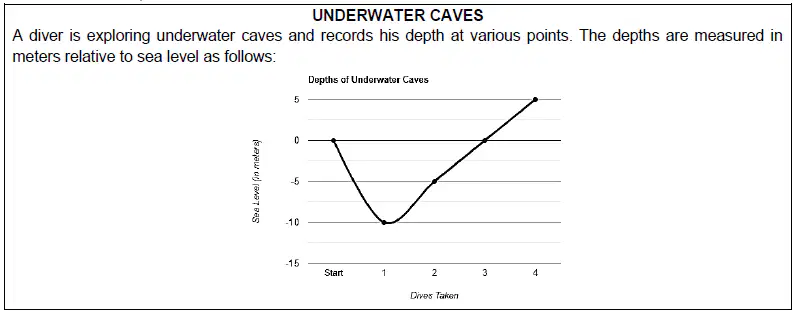
If you were to plot all of these depths on a number line, which of the following integers would be positioned furthest from sea level?
-10
-5
0
5
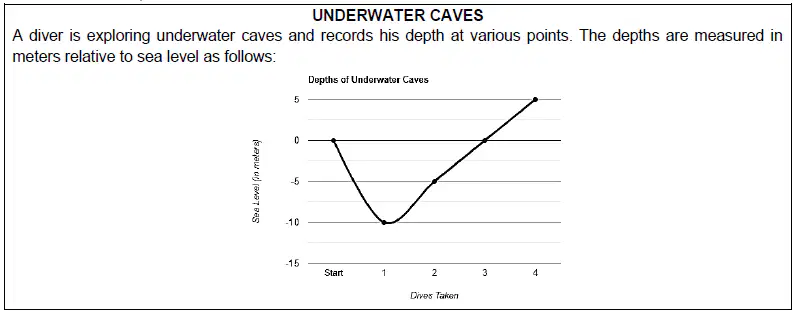
If the diver’s depths are represented on a number line, which of the following statements is true?
The depth after the fourth dive is equal to zero.
The depth after the third dive is less than the depth after the first dive.
The depth after the first dive is less than the depth after the second dive.
The depth after the first dive is greater than the depth after the second dive.

Which of the following temperatures is the highest?
-5°C
-1°C
0°C
4°C
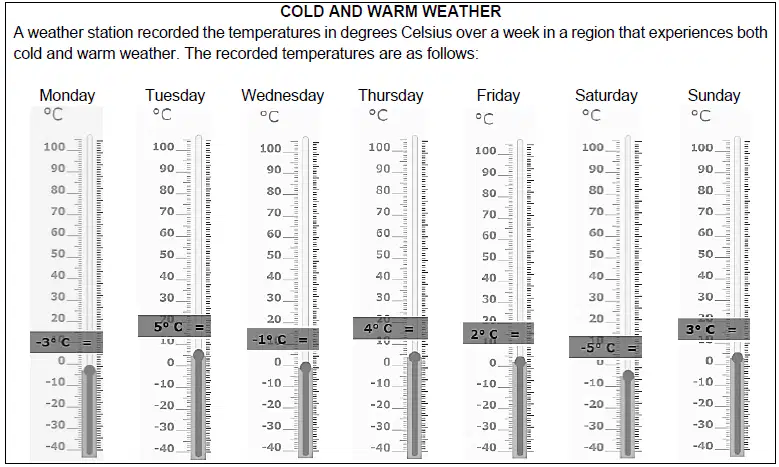
If the temperatures are arranged in increasing order, which is the lowest?
-5°C
-3°C
2°C
4°C

What is the difference between the highest and the lowest temperature recorded?
5°C
6°C
7°C
10°C

If you were to plot the temperatures on a number line, which of the following statements is true?
All temperatures are above zero.
The temperature on Thursday is colder than the temperature on Sunday.
The temperature on Wednesday is warmer than the temperature on Monday.
The temperature on Saturday is closer to zero than the temperature on Friday.
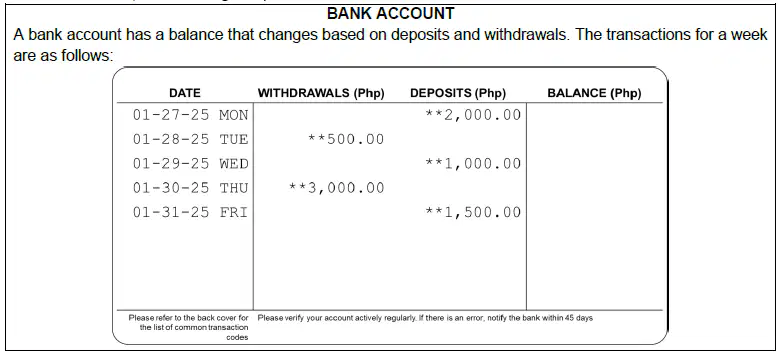
How would you represent the withdrawal of Php500?
-500
0
500
+500
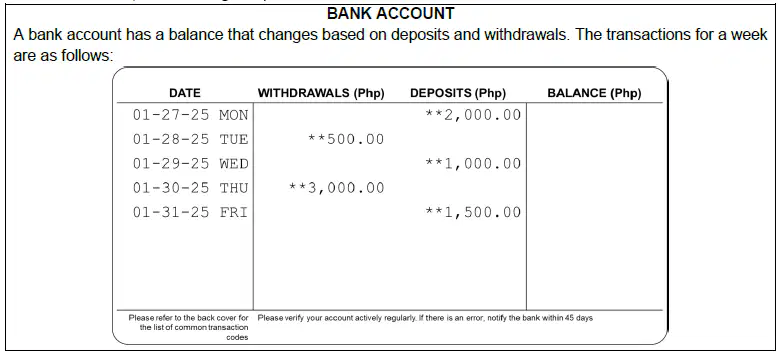
What is the remaining balance after the transactions on Monday and Tuesday have been made?
Php1000
Php1500
Php2000
Php2500
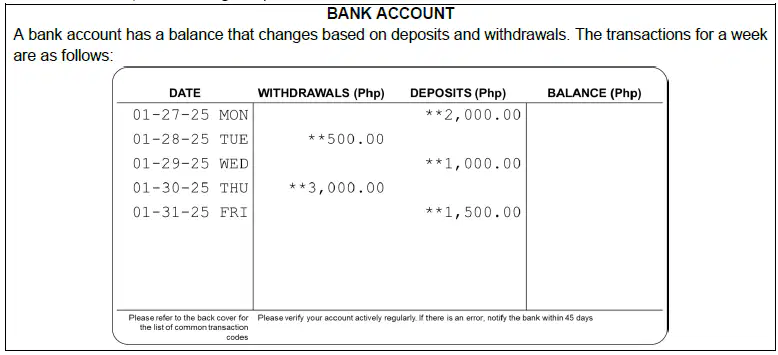
How much money is left at the end of the week after all transactions?
Php1000
Php1500
Php2000
Php2500
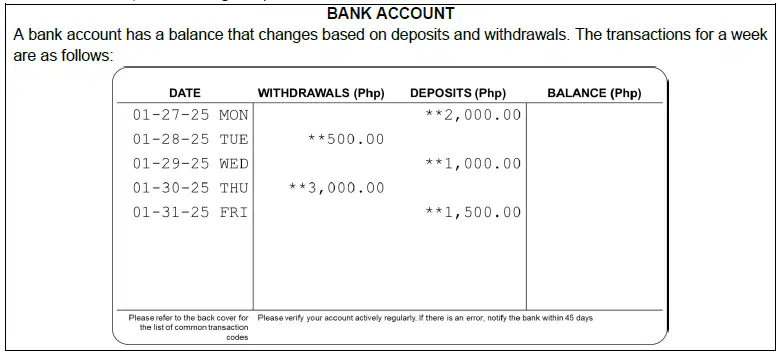
If the account continues to operate under the same pattern for another week with similar transactions, what can be concluded after two weeks?
The balance will always be negative Php500.
The balance will increase by Php1000 each week.
The balance will decrease by Php1000 each week.
The balance will remain constant regardless of deposits and withdrawals.

If the farmer sells 5 sheep each week, how many sheep does he sell in all after 4 weeks?
10
15
20
25

How many new sheep does the farmer acquire over the same period?
4
8
10
12

After selling and acquiring, how many sheep does the farmer have?
18
20
22
24

If the pattern continues for another 4 weeks, what can be concluded about farmer’s herd size?
The herd will remain constant.
The herd will increase over time.
The herd will completely disappear over time.
The herd will fluctuate without a clear trend.

If the gym wants to know the number of memberships for the first week, which expression will represent this calculation?
10 - 3
10 + 3
10 × 3
10 ÷ 3

Which expression represents the number of actual members who worked out in the local gym for week 2?
2 - 5 = -3
5 - 2 = 3
5 + 2 = 7
5 × 2 = 10

How many actual members are there at the local gym over the entire month?
18
20
22
26

How would you describe the membership growth of the local gym if the pattern continues for another month?
Memberships will remain constant.
Memberships will continue to grow.
Memberships will decrease significantly.
Memberships will not be affected by the pattern.
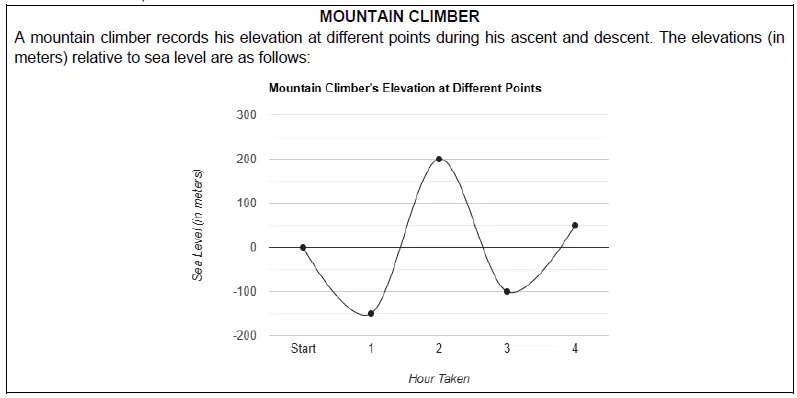
What does the absolute value of an integer represent in this situation?
The total elevation gains during the climb.
The maximum height the climber reaches.
The elevation of the climber above sea level.
The distance of the climber from sea level, regardless of direction.

What is the distance of the mountain climber from the sea level after 1 hour?
50 meters
100 meters
150 meters
200 meters

Based on the recorded distance of the mountain climber from the sea level, what can be concluded about his highest point relative to sea level?
The climber was always below sea level.
The climber never reached above sea level.
The climber's highest point was less than his lowest point.
The climber reached a maximum elevation of 200 meters above sea level.

