
 Worksheets
Ultimate Math Q3 G7 Exam
Total questions: 220
Worksheet time: 3hrs 39mins
_____ is a branch of Mathematics that deals with the collection, organization, presentation, analysis, and interpretation of data.
Statistics
population
census
sample
A _____ is a complete collection of all elements (scores, people, etc.) to be studied.
Statistics
population
census
sample
A t is a collection of data from every element of a population.
Statistics
population
census
sample
A _____ is a subcollection of elements drawn from a population.
Statistics
population
census
sample
In a t, each member of the population has an equally likely chance of being selected. The members of the sample are chosen independently of one another.
random sample
convenience sample
stratified random sample
cluster sample
systematic sample
A _____ is a sample that is chosen because of its convenient proximity and accessibility to the researcher
random sample
convenience sample
stratified random sample
cluster sample
systematic sample
In a _____, the population is divided into subgroups, so that each population member is in only one subgroup. Here, individuals are chosen randomly from each subgroup.
random sample
convenience sample
stratified random sample
cluster sample
systematic sample
A _____ is a sample that consists of items in a group, such as a neighborhood or a household. The group may be chosen at random.
random sample
convenience sample
stratified random sample
cluster sample
systematic sample
A _____ is obtained using an ordered list of the population, thus selecting members systematically from the list.
random sample
convenience sample
stratified random sample
cluster sample
systematic sample
_____ consists of numbers representing counts or measurements.
Quantitative data
Qualitative data
Discrete data
Continuous data
_____ can be separated into different categories distinguished by some non-numeric characteristics.
Quantitative data
Qualitative data
Discrete data
Continuous data
heights of the students in a grade 7 class
Quantitative data
Qualitative data
Discrete data
Continuous data
names given to babies born in the 2000s
Quantitative data
Qualitative data
Discrete data
Continuous data
number of teachers in Peniel Integrated Christian Academy of Rizal.
Quantitative data
Qualitative data
Discrete data
Continuous data
customers’ rating (for example: excellent, satisfactory, or poor) on a certain product bought online
Quantitative data
Qualitative data
Discrete data
Continuous data
_____ result from either a finite number of possible values or a countable number of possible values such as 0, 1, 2, and so on.
Quantitative data
Qualitative data
Discrete data
Continuous data
_____ results from infinitely many possible values that can be associated with points on a continuous scale in such a way that there are no gaps or interruptions
Quantitative data
Qualitative data
Discrete data
Continuous data
The _____ is characterized by data that consist of names, labels, or categories only.
nominal level of measurement
ordinal level of measurement
interval level of measurement
ratio level of measurement
The _____ involves data that may be arranged in some order, but differences between data values either cannot be determined or are meaningless.
nominal level of measurement
ordinal level of measurement
interval level of measurement
ratio level of measurement
The _____ is like the ordinal level, but meaningful amounts of differences between data can be determined. It has no inherent (natural) zero starting point (where none of the quantity is present).
nominal level of measurement
ordinal level of measurement
interval level of measurement
ratio level of measurement
The ratio level of measurement is the interval level modified to include the inherent zero starting point (where zero indicates that one of the quantity is present).
nominal level of measurement
ordinal level of measurement
interval level of measurement
ratio level of measurement
Mechanics have to say whether changing the spark plugs on a new model of a car is very difficult, difficult, easy, or very easy.
nominal level of measurement
ordinal level of measurement
interval level of measurement
ratio level of measurement
Consumers must say whether they prefer brand A, brand B, or no opinion at all.
nominal level of measurement
ordinal level of measurement
interval level of measurement
ratio level of measurement
Military ranks
nominal level of measurement
ordinal level of measurement
interval level of measurement
ratio level of measurement
Number of passengers on provincial buses
nominal level of measurement
ordinal level of measurement
interval level of measurement
ratio level of measurement
IQ of a Grade 7 student
nominal level of measurement
ordinal level of measurement
interval level of measurement
ratio level of measurement
A class adviser requests parents to answer this questionnaire:
a. How often do you consult your child about his or her performance at school?
All the time Frequently Sometimes Never
b. How much effort do you give your child?
A lot of effort A bit of effort Some effort No effort
What type of data collection method does the class adviser use?
Conducting Surveys
Observing the Outcomes of Events
Taking Measurements in Experiments
Reading Statistical Publication
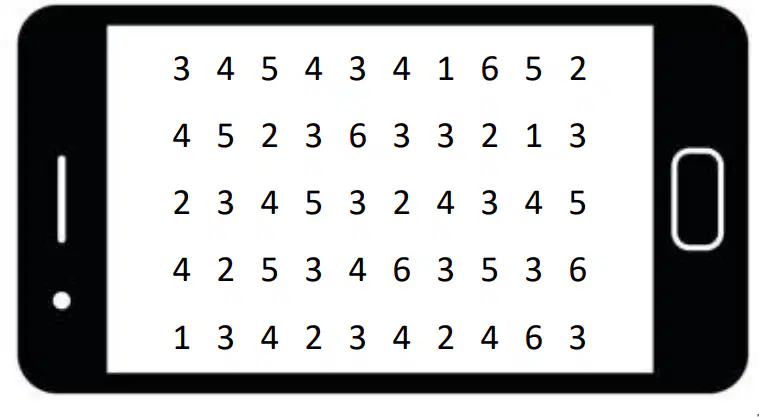
The following data were obtained from the survey on the number of cell phones possessed by each family. The data collected initially is called _____. These are the unprocessed data gathered directly during a survey or research study. In its original form, _____ often appears unstructured and lacks clear patterns or meaningful insights.
raw data
1
2
frequency table
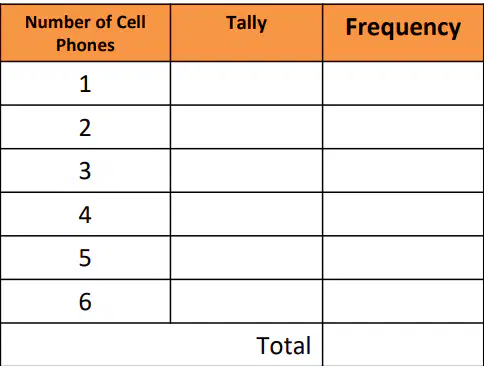
Set up a table using three columns.
raw data
1
2
frequency table
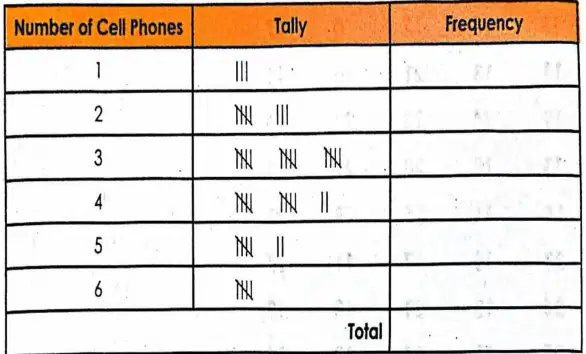
Read each item in the raw data and mark a stroke (or tally) in the Tally column in the same row as its class.
raw data
1
2
frequency table
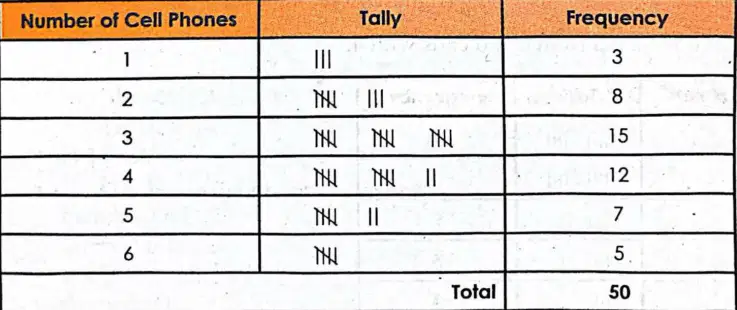
3. The frequency of the class is the number of times each class occurs. Write down the frequency of each class by counting its corresponding tally marks. Find the sum of all the frequencies and write it as shown below.
The table formed is called a _____. A _____ shows clear and definite information about a set of data. With the _____, we can easily tell which class has the lowest frequency.
raw data
1
2
frequency table
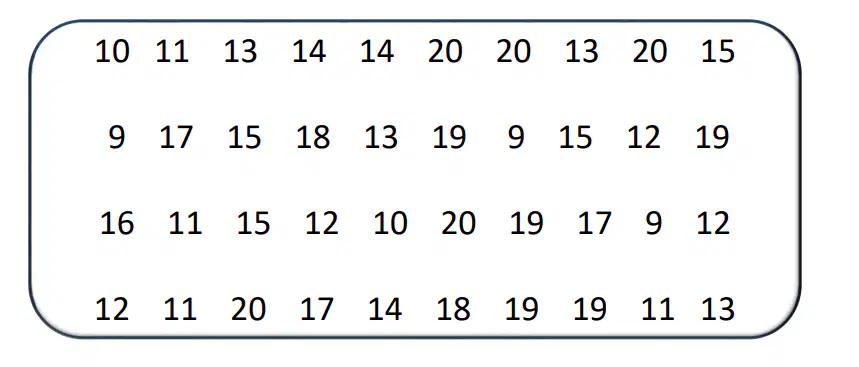
Scores of 40 students in a 20-point Math quiz.
raw data
1
2
frequency table
The frequency table can be obtained by using the _____.
method of tallying
9
20
grouped frequency distribution
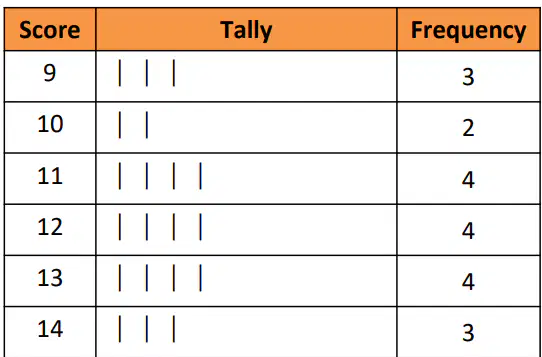
What is the lowest score?
method of tallying
9
20
grouped frequency distribution
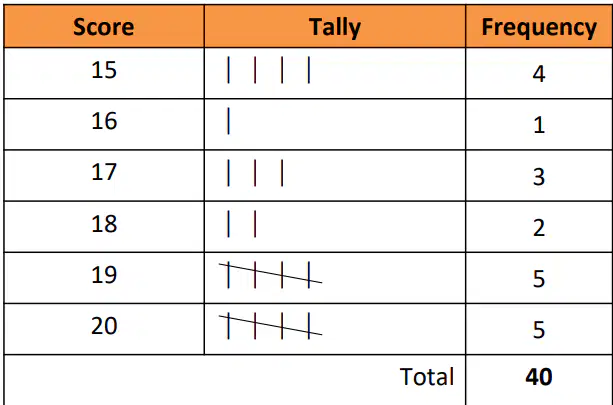
What is the highest score?
method of tallying
9
20
grouped frequency distribution
• The data represented by Table 1, where the tally marks are dropped, is called grouped data. Hence, we call it a _____. • The table shows six class intervals, starting from the lowest class interval (9-10) and ending at the highest interval (19-20).
method of tallying
9
20
grouped frequency distribution
The class intervals are nonoverlapping so that no single item can fall into two classes.
True
False
In the class interval 9-10, the lower limit is 9 and the upper limit is 10. Hence, the left member of the class interval is the lower limit, while the right member is the upper limit.
True
False
Get the difference between the highest score and the lowest score. Add 1 to the difference to arrive at the total number of scores or potential scores. The difference between the highest score and the lowest score is called the range.
Range = 20 - 9 = 11 Total number of potential scores = 11 + 1 = 12
First
Second
Third
Fourth
Fifth
Decide on the number of class intervals that are appropriate to the given set of data. Divide the final number on Step 1 by the desired number of class intervals to arrive at the width of the class interval (i). If 6 is the desired number of the class intervals, then:
i = 12/6 = 2
First
Second
Third
Fourth
Fifth
Write the lowest score in the set of raw scores as the lower limit in the lowest class interval. Add to this value i - 1 to obtain the upper limit in the lowest class interval. The lowest score is 9. Thus, the lowest class interval is 9 - 10 since 9 + i - 1 = 9 + 2 - 1 = 10
First
Second
Third
Fourth
Fifth
The next lower limit can be obtained by adding i to the lower limit of the previous class interval. To get the corresponding upper limit for this class interval, follow Step 3 or add i to the preceding upper limit. Thus, the next lower limit is 11, and the corresponding upper limit is 12, since 9 + 2 = 11 and 10 + 2 = 12.
First
Second
Third
Fourth
Fifth
Continue Step 4 until all the scores are included in their corresponding class intervals.
First
Second
Third
Fourth
Fifth
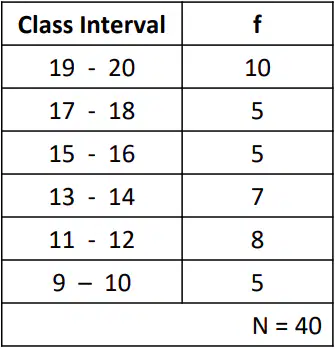
Fill out the f column by following what we have done in frequency distribution
(a)
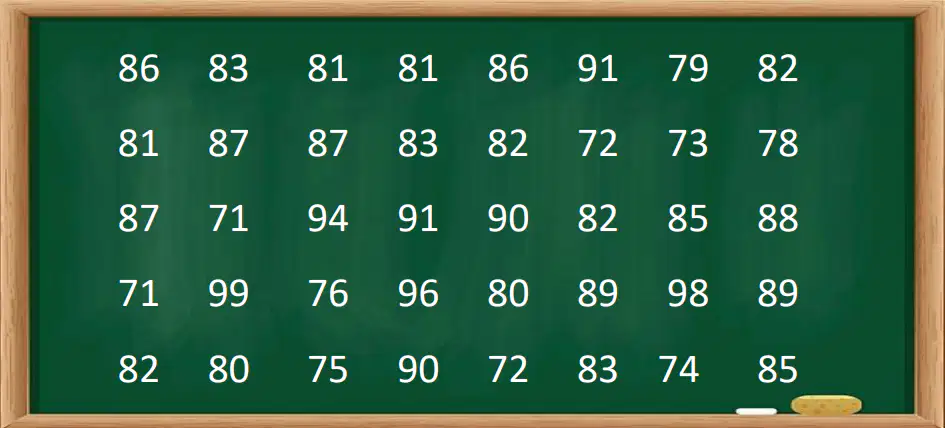
Prepare a _____on the scores of 40 students in a Math exam. Shown below are their scores. Use i = 5.
grouped frequency distribution
Lowest score
Highest score
Lower limit
Upper limit
71
grouped frequency distribution
Lowest score
Highest score
Lower limit
Upper limit
99
grouped frequency distribution
Lowest score
Highest score
Lower limit
Upper limit
71
grouped frequency distribution
Lowest score
Highest score
Lower limit
Upper limit
71 + I(5) - 1 - 71 - 5 + 1 = 75
grouped frequency distribution
Lowest score
Highest score
Lower limit
Upper limit
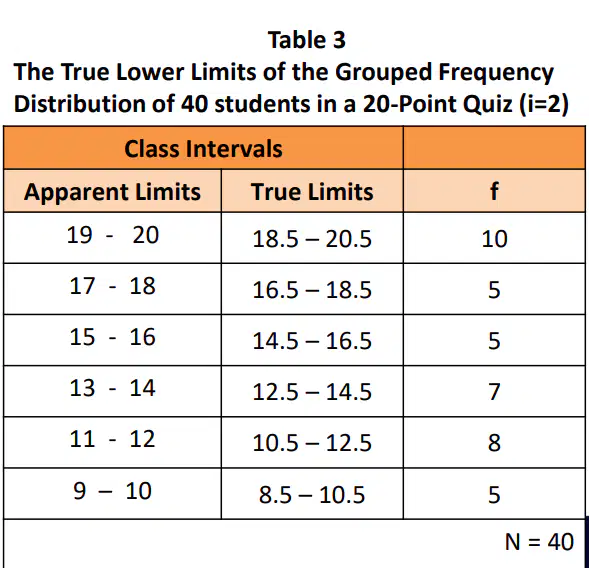
The _____ of a given score are the plus or minus one half of the unit of measure or the place value of the given score. Thus, the true limits of the following scores are as follows:
1) 5, 5 ± 0.5, or 4.5 - 5.5
2) 5.2, 5.2 ± 0.05, or 5.15 - 5.25
3) 5.23, 5.23 ± 0.005, or 5.225-5.235
true limits or class boundaries
cumulative frequency distribution
ogive
stem-and-leaf
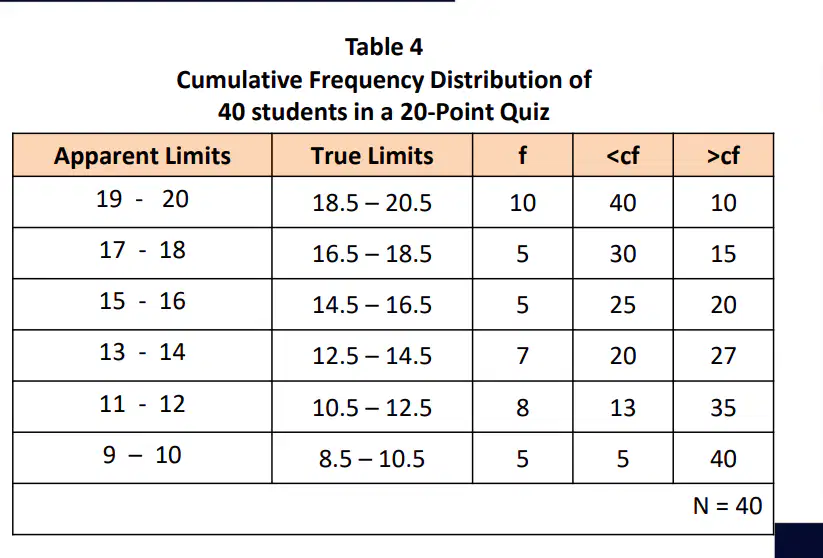
A _____ can be obtained by adding the frequency starting from the frequency of the lowest class interval up to the frequency of the highest class interval. It is also possible to do the reverse; that is, we start to cumulate in the other direction.
Table 4 shows the _____ of the 40 students in a 20-point quiz.
true limits or class boundaries
cumulative frequency distribution
ogive
stem-and-leaf
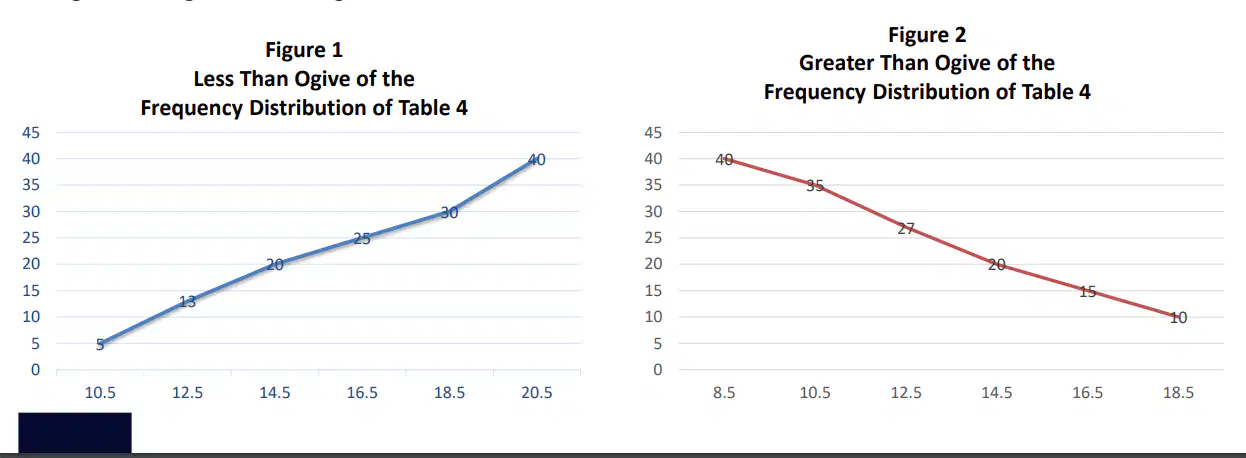
The graph of a cumulative frequency distribution is represented by a line graph known as the _____. In graphing the “less than cumulative frequency,” the cumulative frequencies are plotted against the true upper limits or upper class boundaries. While graphing the “greater than cumulative frequency,” the cumulative frequencies are plotted against the true lower limits or lower class boundaries. The graphs are given in Figure 1 and Figure 2.
true limits or class boundaries
cumulative frequency distribution
ogive
stem-and-leaf
From the grouped frequency distribution itself, we cannot tell what the original items are. We only know that there are ten items in the class 86 - 90. We do not exactly know what items they are. To avoid this problem, we can use the _____ plot.
true limits or class boundaries
cumulative frequency distribution
ogive
stem-and-leaf
Steps in Preparing a Stem-and-Leaf Plot:
First:
Find the least value and the greatest value.
Choose the appropriate stem value. Write stems vertically with a line to their right.
Separate each value into a stem and a leaf by putting the leaves on the plot to the right of the stem.
If you want, on a new plot, arrange the leaves so that they are arranged from least value to greatest value.
Steps in Preparing a Stem-and-Leaf Plot:
Second:
Find the least value and the greatest value.
Choose the appropriate stem value. Write stems vertically with a line to their right.
Separate each value into a stem and a leaf by putting the leaves on the plot to the right of the stem.
If you want, on a new plot, arrange the leaves so that they are arranged from least value to greatest value.
Steps in Preparing a Stem-and-Leaf Plot:
Third:
Find the least value and the greatest value.
Choose the appropriate stem value. Write stems vertically with a line to their right.
Separate each value into a stem and a leaf by putting the leaves on the plot to the right of the stem.
If you want, on a new plot, arrange the leaves so that they are arranged from least value to greatest value.
Steps in Preparing a Stem-and-Leaf Plot:
Fourth:
Find the least value and the greatest value.
Choose the appropriate stem value. Write stems vertically with a line to their right.
Separate each value into a stem and a leaf by putting the leaves on the plot to the right of the stem.
If you want, on a new plot, arrange the leaves so that they are arranged from least value to greatest value.
A _____ is used to represent changes in data over a period of time. Data, like changes in temperature, income, population, and the like, can be represented by a _____. In a _____, data are represented by points and are joined by line segments. A _____ may be curved, broken, or straight. Generally, the horizontal axis is used as the time axis, and the vertical axis is used to show the changes in the other quantity.
line graph
bar graph
pie graph or pie chart
pictograph
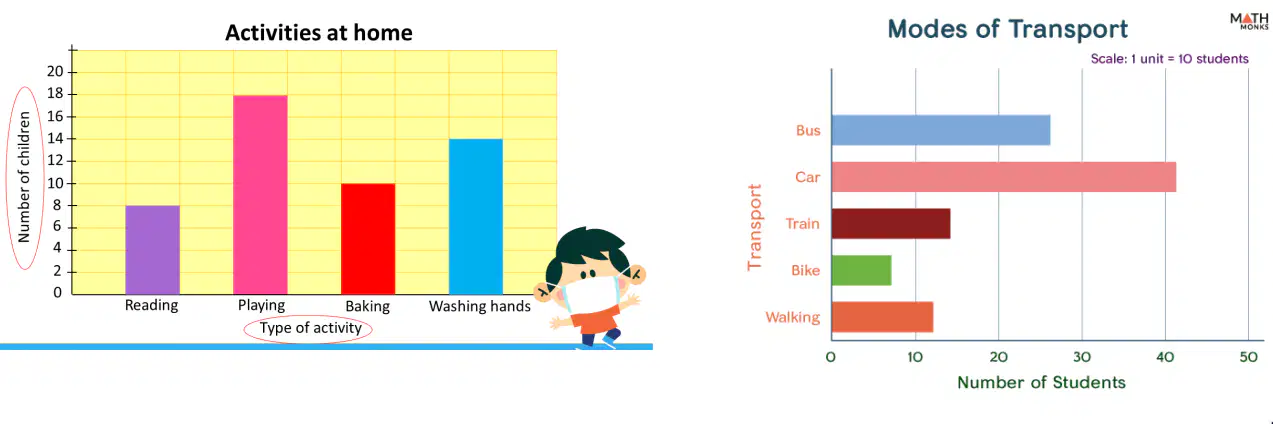
A _____ is a graph that uses horizontal or vertical bars to represent data. When a _____ has bars that extend from left to right, it is called a horizontal _____. On the other hand, if the bars extend from bottom to top, it is called a vertical _____. In a vertical _____, the vertical line is called the scale of the _____, while in a horizontal _____, the horizontal line is the scale of the _____. The length of a bar represents a quantity. Hence, the bars, which are representations of the quantities, can easily be compared by examining the lengths of the bars. Since only the lengths of the bars are important, the widths are all made equal. A gap between the bars is spaced equally to make them stand out better.
line graph
bar graph
pie graph or pie chart
pictograph
A _____ or _____ is another visual representation of data. It is used to show how all the parts of something are related to the whole. It is represented by a circle divided into slices or sectors of various sizes that show each part’s relationship to the whole and to the other parts of the circle.
line graph
bar graph
pie graph or pie chart
pictograph
A _____ is a graph that uses pictures to illustrate data. To construct a _____, the following steps are to be followed:
a) Collect the necessary data.
b) Round off the numerical data if necessary.
c) Choose an appropriate symbol to represent the subject.
d) Indicate the quantity each symbol represents.
line graph
bar graph
pie graph or pie chart
pictograph
On a pie or circle graph, 25% represents _____.
25/100 x 360
75/100 x 360
90/360
180/360
On a pie graph, 75% represents _____.
25/100 x 360
75/100 x 360
90/360
180/360
On a pie graph, a sector having 90º represents _____.
25/100 x 360
75/100 x 360
90/360
180/360
On a pie graph, a sector having 180º represents
25/100 x 360
75/100 x 360
90/360
180/360
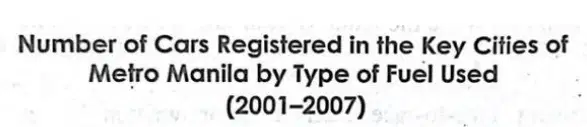
What is it?
table heading
body
stubs
box heads/column captions
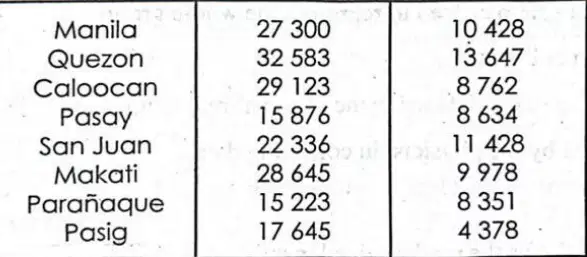
What is it?
table heading
body
stubs
box heads/column captions
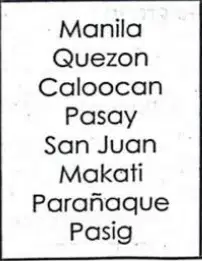
What is it?
table heading
body
stubs
box heads/column captions

What is it?
table heading
body
stubs
box heads/column captions
The set of integers consists of all positive whole numbers, all negative whole numbers, and zero.
ℤ = { . . . , -3, -2, -1, 0, 1, 2, 3, . . . }
TRUE
FALSE
The set of positive integers is equal to the set of natural numbers.
TRUE
FALSE
Positive integers may not be written with or without a plus sign (+) before them.
Example: +7 = 7
TRUE
FALSE
Negative integers aren't written with a minus sign before them.
Example: 7 - 14
TRUE
FALSE
Zero is signless since it is neither positive nor negative.
TRUE
FALSE
Numbers that are of the same distance from zero (the origin) but on opposite sides of zero are called _____.
opposites
Integers
_____ can be used to be describe situations involving temperature, profit or loss, time before or after, a lift of a space shuttle, and elevation of land. In all of these examples, _____ are used to count positive and negative units.
opposites
Integers
Identify the type of integer being described by the given words.
Select + if it is a positive integer and – if it is a negative integer.
earned
+
-
Identify the type of integer being described by the given words.
Select + if it is a positive integer and – if it is a negative integer.
spent
+
-
Identify the type of integer being described by the given words.
Select + if it is a positive integer and – if it is a negative integer.
profit
+
-
Identify the type of integer being described by the given words.
Select + if it is a positive integer and – if it is a negative integer.
won
+
-
Identify the type of integer being described by the given words.
Select + if it is a positive integer and – if it is a negative integer.
acquired
+
-
Identify the type of integer being described by the given words.
Select + if it is a positive integer and – if it is a negative integer.
deposit
+
-
Identify the type of integer being described by the given words.
Select + if it is a positive integer and – if it is a negative integer.
loss
+
-
Identify the type of integer being described by the given words.
Select + if it is a positive integer and – if it is a negative integer.
decrease
+
-
Identify the type of integer being described by the given words.
Select + if it is a positive integer and – if it is a negative integer.
gain
+
-
Identify the type of integer being described by the given words.
Select + if it is a positive integer and – if it is a negative integer.
above
+
-
Identify the type of integer being described by the given words.
Select + if it is a positive integer and – if it is a negative integer.
fell
+
-
Identify the type of integer being described by the given words.
Select + if it is a positive integer and – if it is a negative integer.
drop
+
-
Identify the type of integer being described by the given words.
Select + if it is a positive integer and – if it is a negative integer.
forward
+
-
Identify the type of integer being described by the given words.
Select + if it is a positive integer and – if it is a negative integer.
down
+
-
Identify the type of integer being described by the given words.
Select + if it is a positive integer and – if it is a negative integer.
debt
+
-
_____ is always a positive value (or zero).
Distance
Absolute Value
_____ describes the distance between a number and zero on the number line without considering direction.
Distance
Absolute Value
The absolute value of a number is never negative.
TRUE
FALSE
The absolute value of a number is denoted by two bars ││.
TRUE
FALSE
It is important to note that the absolute value bars work in the same way as parentheses do. Example: -│-3│ = -3, = – (–3) = -3.
TRUE
FALSE
If x is a positive integer or zero, then the absolute value of x is x.
|x| = x, if x > 0 |x| = x, if x = 0
TRUE
FALSE
If x is a negative integer, then the absolute value of x is the opposite of x.
|-x| = x. if x < 0
TRUE
FALSE
The absolute value of -3 is 3.
TRUE
FALSE
The absolute value of an integer is always greater than the integer.
TRUE
FALSE
|+5| = 5
TRUE
FALSE
|-5| = -5
TRUE
FALSE
- |+5| = 5
TRUE
FALSE
- |-5| = -5
TRUE
FALSE
|-7| + |+5| =
(a)
|10| - |-8| =
(a)
|+3| - |-3| =
(a)
|-8| + |17| =
(a)
An (a) is a mathematical statement that contains the symbol >, ≥, <, ≤, or ≠.
-3[_____]6
>
<
=
0[_____]5
>
<
=
-7[_____]7
>
<
=
-0[_____]-10
>
<
=
-8[_____]-2
>
<
=
14[_____]-15
>
<
=
-36[_____]-38
>
<
=
42[_____]24
>
<
=
-16[_____]14
>
<
=
-154[_____]-154
>
<
=
The grade (g) must be at least 85.
≥
≤
The age (a) must be at most 60 years.
≥
≤
You can use (a) to represent integers. A + tile represents +1. A - tile represents -1.
++++ = 4 and ---- = -4
1 + 4
(a)
4 + 3
(a)
1 + (-4)
(a)
4 + (-3)
(a)
(-1) + 4
(a)
(-3) + 4
(a)
(-1) + (-4)
(a)
(-3) + (-2)
(a)
Find the sum of their absolute values and use the sign common on both integers.
LIKE SIGNS: (+) + (+) or (-) + (-)
Positive + Positive = Positive Answer
Negative + Negative = Negative Answer
5 + (8) = 13
LIKE SIGNS: (+) + (+) or (-) + (-)
Positive + Positive = Positive Answer
Negative + Negative = Negative Answer
-3 + (-12) = -15
LIKE SIGNS: (+) + (+) or (-) + (-)
Positive + Positive = Positive Answer
Negative + Negative = Negative Answer
Find the difference of their absolute values and use the sign of the integer with the greater absolute value.
UNLIKE SIGNS: (+) + (-) or (-) + (+)
If the number with the greater absolute value is positive, the answer is also positive
If the number with the greater absolute value is negative, the answer is also negative.
23 + (-8) = 23 – 8 = 15
UNLIKE SIGNS: (+) + (-) or (-) + (+)
If the number with the greater absolute value is positive, the answer is also positive
If the number with the greater absolute value is negative, the answer is also negative.
(-13) + 7 = -6
UNLIKE SIGNS: (+) + (-) or (-) + (+)
If the number with the greater absolute value is positive, the answer is also positive
If the number with the greater absolute value is negative, the answer is also negative.
40 + 5
(a)
40 + (-5)
(a)
(-40) + 5
(a)
(-40) + (-5)
(a)
(-9) + 10
(a)
a + (-a) = 0 and – a + a = 0
Addition Property of Opposites
Addition Property of Zero
a + 0 = 0 + a = a, for any number a
Addition Property of Opposites
Addition Property of Zero
5 + (-3)
(a)
-6 + (4)
(a)
-2 + (8)
(a)
12 + 5 + 3
(a)
21 + (-25) + (-8)
(a)
(-15) + 23 + 6
(a)
7 – 4
(a)
4 – 5
(a)
2 – (-4)
(a)
(-2) – 4
(a)
(-5) – (-2)
(a)
(-2) – (-5)
(a)
(12) – (6)
(a)
(-15) – (-10)
(a)
(-10) -(3)
(a)
4 – (-8)
(a)
1 - 4
(a)
-3 – (-5)
(a)
-2 – 4
(a)
(-9) – (7) – (-2)
(a)
(-8) – (-12) – (3)
(a)
26 - 8
(a)
15 - (-2)
(a)
(-55) - 13
(a)
(-18) - (-10)
(a)
12 – (-24) – 10
(a)
Fill in each [_] with <, >, or = to make a true statement
-3 -(-5) [_] -6 - (-7)
(a)
Fill in each [_] with <, >, or = to make a true statement
|-4| - |7| [_] |8| - |-8|
(a)
Find the difference in altitude between a mountain 2 853 ft. high and a valley 375 ft. below sea level.
(a)
The melting points of mercury, nitrogen, lithium, and sulfur are -39ºC, -210ºC, 181ºC, and 113ºC, respectively. Find the difference between the sum of the melting points of mercury and nitrogen from the sum of the melting points of lithium and sulfur.
(a)
1. When you multiply two numbers with the same sign, the product is (a) .
(+5) × (+7)
(a)
(-3) × (-12)
(a)
(+8) × (+10)
(a)
(-20) × (-2)
(a)
2. When you multiply two numbers with different signs, the product is (a) .
(+3) × (-8)
(a)
(-13) × (+4)
(a)
(-9) × (9)
(a)
(12) × (-6)
(a)
12 ● 15
(a)
18 ● (-3)
(a)
(-21) ● 6
(a)
(-30) ● (-10)
(a)
0 ● (-50)
(a)
(-10) ● (?) = 30
(a)
(?) ● (5) = 25
(a)
(?) ● (14) = -84
(a)
(-3) ● (-6) ● (?) = -162
(a)
(-1) ● (-2) ● (?) ● (-8) = 80
(a)
If the number of negative factors is odd, the product is (a) .
(-3) ● (-7) ● (-12)
(a)
(-7) ● (-6) ● (-5) ● (-1) ● (-10)
(a)
If the number of negative factors is even, the product is (a) .
(-22) ● (-4)
(a)
(-11) ● (-5) ● (-2) ● (-21)
(a)
The change in the price of stocks in Exponent Corporation for Wednesday is reported as –₱200.00 per share. If you own 10 shares of Exponent Stock, what integer represents the total change in value of your shares stock?
(a)
1. When two numbers with the same sign are divided, the quotient is always (a) .
9/3
(a)
-18/-9
(a)
-10/-2
(a)
2. When two numbers with different signs are divided, the quotient is always (a) .
9/-3
(a)
-18/9
(a)
10/-2
(a)
121 ÷ 11
(a)
36 ÷ (-3)
(a)
(-50) ÷ 5
(a)
(-150) ÷ (-10)
(a)
0 ÷ (-50)
(a)
250/N = 50
(a)
N/8 = -45
(a)
N/300 = 0
(a)
600/N = -6
(a)
100 – 8 • 3 + 16 ÷ 2
(a)
-40 ÷ 5 – 7 • 3 + (6 + 2 • 7)
(a)
Tom played golf at an amusement park. His scores on the first five holes were -2, -1, +2, +1, and +2. What was his mean (average) score for those holes?
(a)

