
Font size
 Worksheets
Reading a Weather Map-JONES
Total questions: 74
Worksheet time: 55mins


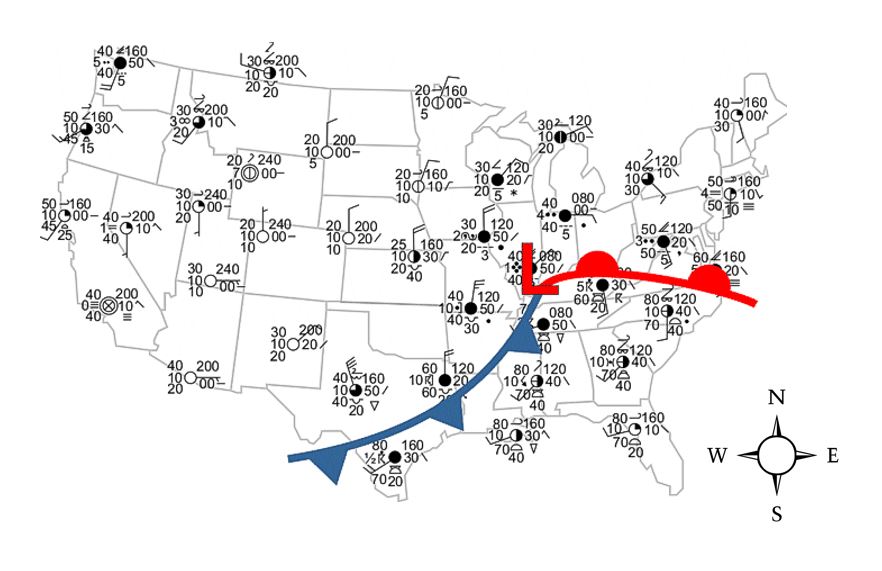
What city will experience decreasing temperatures in the next day?
Denver
El Paso
Memphis
Los Angeles
The closer together the isobars are on a weather map ...
the weaker the winds
the stronger the winds
the hotter the temperature
the cooler the temperature


What does the following weather symbol represent?
Sunny with clear skies
Partly cloudy
Overcast

What does the following weather symbol represent?
Sunny with clear skies
Partly cloudy
Overcast

What does this image represent?
sunny
Thunderstorms
Rain
Partly cloudy

What does this weather symbol mean?
Rain
Thunderstorm
Partly Cloudy
Sunny


Near which two cities are the low pressure systems located?
Seattle & San Francisco
Chicago & Seattle
Dallas & Houston
Chicago & Nashville

Near which city is the high pressure system located?
Seattle
Minneapolis
Dallas
Chicago

Which two cities are most likely to experience clear, dry weather?
Seattle & San Francisco
Chicago & Minneapolis
Chicago & Nashville
Dallas & Houston
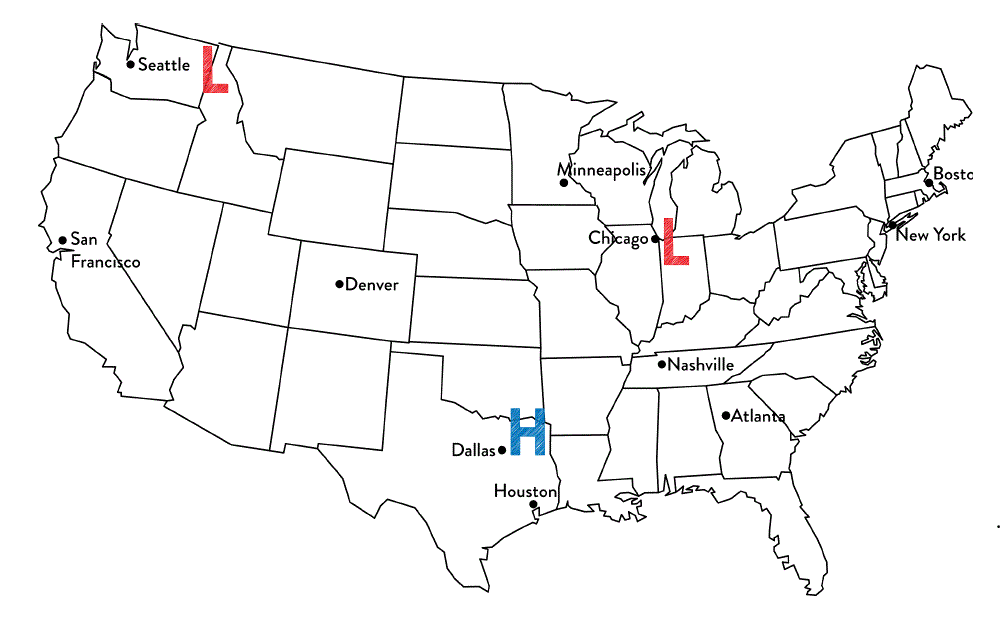
Tim said that Chicago is most likely to experience rainy weather. Jennifer thinks that Dallas is most likely to experience rainy weather.
Which student is correct?
Tim because Chicago is the closest to a low pressure system and they produce precipitation.
Jennifer because high pressure systems produce precipitation
Both students are correct because all systems produce precipitation
Neither of the students are correct because the cities are not close enough to the system.

What type of weather is generally associated with a low pressure system?
fair-weather, beautiful clear skies
Cloudy skies, some moist air, possible precipitation, stormy weather
cloudy skies, dry air
cloudy with a chance of meatballs

Which location is most likely experiencing warmer temperatures and higher humidity?
Location A
Location B
Location C
Location D

heavier, sinking air
high pressure
low pressure
lighter, rising air
high pressure
low pressure

tornado
extreme high pressure
extreme low pressure

humid air
high pressure
low pressure
Humidity can
increase the chance of precipitation because the water vapor can condense to form rain drops in the clouds.
decrease the chance of precipitation because the water vapor cannot condense.
Higher temperatures
can cause higher humidity because water evaporates more quickly at warmer temperatures.
can cause lower humidity because water evaporates less quickly at warmer temperatures.
can cause the same amount of humidity as lower temperatures.

Scientists use a curved line to show a front and the symbols (triangles or half circles) face
the direction the front is moving.
the direction the front is coming from.
Cold fronts typically occur where
the pressure change is the greatest.
the pressure change is the least.
the pressure change is 0.
Cold fronts
increase air pressure as air cools and sinks.
decrease air pressure as air cools and sinks.
Warm fronts
increase air pressure as air warms and rises.
decrease air pressure as air warms and rises.

The cold front is moving
east and southeast
west and northwest
north
south
A cold front is approaching Minneapolis. What will happen to the air temperature?
stay the same
increase
decrease


Based on the graph, choose the statements that are true. (choose all that apply)
The summer months (June, July, August) are the most active months for tornadoes in Oklahoma.
The fall months (September, October, November) are the least active months for tornadoes in Oklahoma.
The winter months (December, January, February) are the least active months for tornadoes in Oklahoma
The spring months (March, April, May) are the most active months for tornadoes in Oklahoma.

The jet stream is a global pattern of atmospheric movement that influences patterns in local weather. Based on the information provided in the weather map, which city shown most recently experienced a temperature rise?
Detroit
Amarillo
Orlando
Reno

This weather map of the United States shows the location of four cities and the direction of movement of four different air masses. The data table gives the air pressure in the four cities. Which air mass is demonstrating a flow of air from high to low pressure?
A
B
C
D

The jet stream is a global pattern of atmospheric movement that influences patterns in local weather. Based on the information provided in the weather map, which city shown will most likely experience a drop in pressure over the next few days?
Baltimore
Jacksonville
Portland
Rapid City

Look at the image. Which city is about to have a cold front?
El Paso
Los Angeles
Memphis

When a cold front passes through, the temperature gets warmer!
True
False

Which city is about to have a warm front?
St. Louis
Atlanta

Which city will most likely experience decreasing temperatures during the next 24 hours?
Minneapolis
Atlanta

Select the type of front that matches the diagram.
Warm Front
Cold Front

Select the type of front that matches the diagram.
Warm Front
Cold Front
Cool Air sinking.
Brings sunny and clear weather.
Low Pressure
High Pressure
Warm Air rising.
Brings clouds and precipitation.
High Pressure
Low Pressure

Moving warm air mass that overtakes colder air.
Brings light rain/snow and warmer temperatures.
Cold Front
Warm Front

Moving cold air that pushes warm air up into the atmosphere.
Brings heavy rain/snow, thunderstorms and colder temperatures.
Warm Front
Cold Front
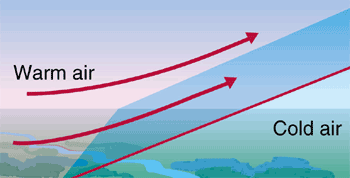
Why does warm air rise above cold air?
Warm air is less dense
Warm air is more dense

What direction does air move to create WIND?
High pressure-> Low pressure
Low pressure-> High pressure

