wayground logo

Free Printable Worksheets

Font size

S
M
L
XL
Worksheets

T2 Final Review #1

Total questions: 84

Worksheet time: 4hrs 15mins

Name
Class
Date
1.

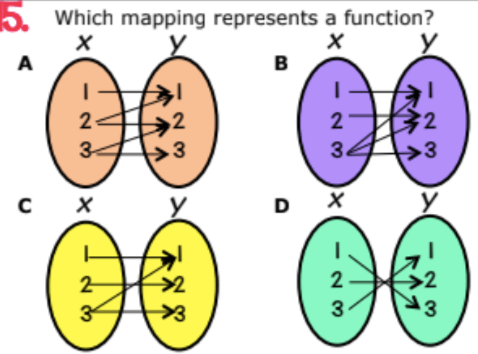
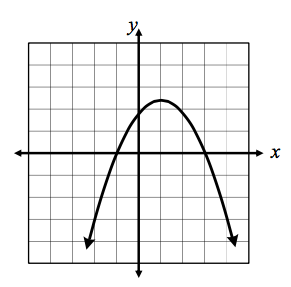
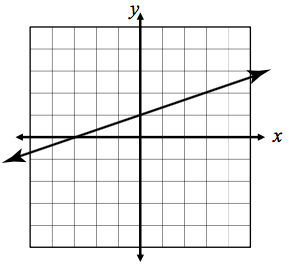
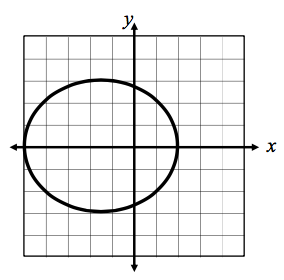
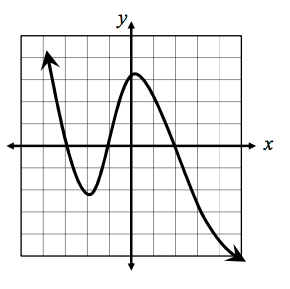
Which graph represents a function? Select all that apply.

a)
b)
c)
d)
2.

Determine whether the mapping diagram represents a function.

a)

Function

b)

Not a function

3.

Determine whether the mapping diagram represents a function.

a)

Function

b)

Not a function

4.

Determine whether the table of values represents a function.

a)

Function

b)

Not a function

5.

What is the definition of function?

a)

Has inputs and outputs

b)

Every input has only ONE output

c)

Inputs have different outputs every time

d)

x-values and y-values

6.

Does the mapping of these points represent a function? (Note: the left oval represents your x values and the right oval represents your y values)

a)

Function

b)

Not a Function

7.

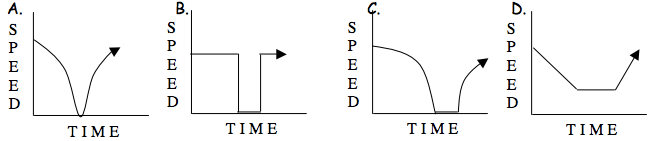
Determine whether the table of values represents a function.

a)

Function

b)

Not a function

8.

Does this represent a function?

a)

Yes

b)

No

9.
a)

A

b)

B

c)

C

d)

D

10.

Which of these tables represent a function?

a)

A

b)

B

c)

C

d)

D

11.

Does this table represent a function?

a)

Yes

b)

No

12.

Does this represent a function?

a)

Yes

b)

No

13.

a)

A

b)

B

c)

C

d)

D

14.
a)
Function
b)
Not a Function
15.
a)
It is a function because each x has only one y.
b)
It's not a function because an x has multiple y's.
c)
It's not a function because a y has multiple x's.
d)
It is a function because each y has only one x.
16.

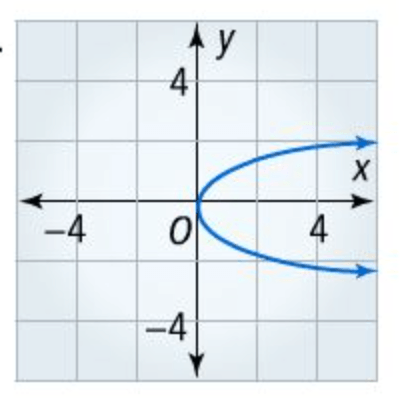
Is the graph pictured a function?

a)

Yes

b)

No

17.

Is this a function or not a function?

a)

Function

b)

Not a Function

18.
a)
Function
b)
Not a Function
19.
a)
Function
b)
Not a Function
20.
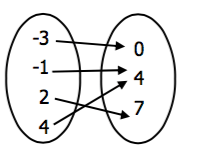
Is this mapping a function or not a function? 
a)
Function
b)
Not a Function
21.
All of the y values or outputs are called what?
a)
Domain
b)
Range
c)
Relation
d)
Function
22.
All of the x values or inputs are called what?
a)
Domain
b)
Range
c)
Relation
d)
Function
23.
Which of these is NOT the same
a)
Range
b)
Input
c)
Dependent Value
d)
Y-Value
24.
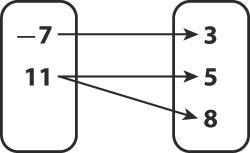
Is the relation a function? Why.
a)
Yes, because the x-value 11 has two y-values pair with it.
b)
Yes, because each x-value has only one y-value paired with it.
c)
No, because the x-value 11 has two y-values pair with it.
d)
No, because each x-value has only one y-value paired with it.
25.
Is this mapping a function or not a function? 
a)
Function
b)
Not a Function 
26.
Is this graph a function or not a function? 
a)
Function
b)
Not a Function
27.
Is this graph a function or not a function? 
a)
Function
b)
Not a Function
28.
Is this table a function or not a function? 
a)
Function
b)
Not a Function
29.
Which set of values is a function?
a)
(9,5) (10,5) (9,-5) (10,-5)
b)
(3,4) (4,-3) (7,4) (3, 8)
c)
(6,-5) (7, -3) (8, -1) (9, 1)
d)
(2, -2) (5, 9) (5, -7) (1, 4)
30.
Is this graph a function or not a function? 
a)
Function 
b)
Not a Function 
31.
Which ordered pair could you add to the following list of points to create a function?  (3, 5) (4, 9) (2, 5) 
a)
(3, 7)
b)
(4, 1) 
c)
(1, 9)
d)
(2, 6)
32.
Does the table represent a function?
a)
Yes, there  is a repeated x-value. 
b)
No, there aren't any repeated y-values. 
c)
Yes, there are repeated y-values. 
d)
No, there is a repeated x-value. 
33.
Is this graph a function or not a function? 
a)
Function 
b)
Not a Function
34.
Which graph does NOT pass the vertical line test?
a)
Graph 1
b)
Graph 2
c)
Graph 3
d)
Graph 4
35.
On what interval is the graph decreasing?
a)
(∞, 3)
b)
(3, -∞)
c)
(3, ∞)
d)
(-∞, 3)
36.

What is the interval of increase?

a)

From 0 to 3

b)

From 3 to 7

c)

From 25 to 40

d)

From 50 to 25

37.

What is the interval of decrease?

a)

From 0 to 3

b)

From 3 to 7

c)

From 25 to 40

d)

From 50 to 25

38.

Let's call the graph f(x). Find f(5) = ___

a)

25

b)

30

c)

35

d)

40

39.
Domain is: 
a)
All x values, from left to right.
b)
All y values, from bottom to top.
c)
All x values from bottom to top. 
d)
All y values from left to right.
40.
Range is:
a)
All x values, from left to right.
b)
All y values, from left to right. 
c)
All y values, from bottom to top.
d)
All x values, from bottom to top.
41.
Where is the function increasing?
a)
(-∞,5]
b)
(-∞,0]
c)
(-∞,2]
d)
[0,2]
42.

Where is the function negative?

a)

(-∞,5]

b)

(-∞,0]

c)

(-∞,2]

d)

[0,2]

43.
Name the parent function.
a)
cube root
b)
quadratic
c)
cubic
d)
square root
44.
Name the parent function.
a)
linear
b)
quadratic
c)
absolute value
d)
cubic
45.
Name the parent function.
a)
linear
b)
quadratic
c)
cubic
d)
logarithmic
46.
Name the parent function. 
a)
constant
b)
quadratic
c)
linear
d)
exponential
47.
Name the parent function.
a)
cubic
b)
cube root
c)
exponential
d)
quadratic
48.

Find the interval(s) of increase of the graph shown.

a)

(-6, -4)

b)

(-4, -2)

c)

(-2, 2)

d)

(2, 5)

e)

(5, 6)

49.

Find the interval(s) of decrease of the graph shown.

a)

(-6, -4)

b)

(-4, -2)

c)

(-2, 2)

d)

(2, 5)

e)

(5, 6)

50.

Find the interval(s) where the graph remains constant.

a)

(-6, -4)

b)

(-4, -2)

c)

(-2, 2)

d)

(2, 5)

e)

(5, 6)

51.
What is happening in this graph from point B to C?
a)
The object is going down a hill.
b)
The object is returning to its starting location.
c)
The object is slowing down.
d)
The object is staying still.
52.
Between 4th and 8th seconds the helicopter's speed is .....................
a)
Increasing
b)
Decreasing
c)
stationary
53.
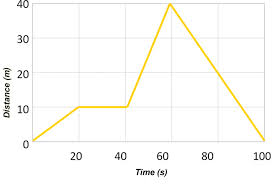
What is the total distance covered by 2 pm?
a)
40 miles
b)
30 miles
c)
60 miles
d)
10 miles
54.
The sales record for a recent hit CD at Tony’s Music Store is shown on the graph.  Which statement best describes the sales of this CD?
a)
Sales rapidly increased, reached a peak, and then gradually decreased.
b)
Sales gradually increased, reached a peak, and then leveled off.
c)
Sales rapidly increased, reached a peak, and then rapidly decreased
d)
Sales remained constant throughout the time period.
55.
A driver stopped her car for a traffic light. After waiting for the light to turn green, the driver continued on her way. 
a)
A
b)
B
c)
C
d)
D
56.
Between which seconds is the line INCREASING?
a)
Between 7 and 12 seconds
b)
Between 0 and 1 seconds
c)
Between 1 and 5 seconds
d)
Between 12 and 13.5 seconds
57.
Between which seconds is the line DECREASING?
a)
Between 7 and 12 seconds
b)
Between 0 and 1 seconds
c)
Between 1 and 5 seconds
d)
Between 12 and 13.5 seconds
58.
Between which seconds is the line STAYING THE SAME?
a)
Between 7 and 12 seconds
b)
Between 0 and 4 seconds
c)
Between 1 and 5 seconds
d)
Between 12 and 13.5 seconds
59.
What does the Y axis represent?
a)
Time
b)
Distance
60.
What does the X axis represent?
a)
Time
b)
Distance
61.
What happened on this graph from 0 to 7 seconds?
a)
The helicopter moved up.
b)
The helicopter stayed at the launching pad.
c)
The helicopter moved down.
d)
You can't tell from this graph.
62.
Pick a point on the graph and describe the meaning:
a)
At 2 seconds the helicopter was 4 meters away.
b)
At 6 seconds the helicopter was 6 meters away.
c)
At 4 seconds, the helicopter was 2 meters away.
d)
At 10 seconds, the helicopter was 0 meters away.
63.
a)
The boat came to a stop after it traveled for 10 minutes. 
b)
The boat was at rest from 20 to 40 minutes. 
c)
The boat traveled the fastest in the last 20 minutes. 
d)
The boat traveled the shortest distance in the first 20 minutes. 
64.

Which graph matches the given story:

The population size grows at a constant rate for some time, then doesn’t change for a while, and then grows at a constant rate once again.

a)
b)
c)
d)
65.

Which graph matches the given story:

The population size grows somewhat fast at first, and then the rate of growth slows.

a)

None of the graphs pictured match the story.

b)
c)
d)
e)
66.

Which story matches the graph?

a)

The population starts at 0 and grows at a constant rate.

b)

The population size declines to zero.

c)

The population size grows at a constant linear rate for some time, then decreases at a constant linear rate for a while, and then increases at a constant linear rate.

d)

The population size grows at a constant rate for some time, then doesn’t change for a while, and then grows at a constant rate once again.

e)

The population size grows somewhat fast at first, and then the rate of growth slows.

67.

At what intervals does the elevation remain the same?

a)

0 - 2 seconds and 8 - 9 seconds

b)

2 - 4 seconds and 6 - 8 seconds

c)

4 - 6 seconds

d)

The elevation never remains the same.

68.

Use the graph to evaluate  f(3)f\left(3\right)  

a)

1.5

b)

5

c)

3

d)

8

69.

Use the graph to evaluate  f(9)f\left(9\right)  

a)

Not possible

b)

5

c)

3

d)

8

70.

Use the graph to solve  f(x)=4f\left(x\right)=4  

a)

x=2

b)

x=6

c)

x=3

d)

Not possible

71.

Use the graph to evaluate  f(2)f\left(-2\right)  

a)

4

b)

3.5

c)

2

d)

0

72.

What does H(5) =18 mean in the context of the problem?

a)

The height of the plant after 5 weeks is 18 inches

b)

The height of the plant after 18 weeks is 5 inches

c)

The height of the plant is 5 inches after 18 weeks

d)

The height of the plant is dependent on the week it was planted

73.

Given the graph of f(x), what does f(6) = 30 mean in context?

a)

When 6 books are sold, the store makes $30

b)

When 30 books are sold, the store makes $6

c)

When 6 books are sold, the store makes $36

d)

The store makes $5 per book.

74.

What does f(1990)=214 mean in the context of the problem?

a)

In 1990 there were 214 million people with health insurance

b)

In 214, there were 1990 people with health insurance

c)

When there are 1990 people, the year is 214

d)

None of these

75.
What is f(1)?
a)
1
b)
5
c)
0
d)
4
76.

The graph models Craig’s trip to visit his friend in another state. In the course of his travels, he encountered both highway and city driving.

What might have happened in the interval between B and C? (Check 2 that apply)

a)

He increased his speed

b)

He stopped at a rest stop for food and gas

c)

He turned around and went back home

d)

He was caught in stand still traffic

77.
For the function f(x) = -3(x-1) find f(0).
a)
0
b)
-3
c)
3
d)
-1
78.
Function notation
If f(x) = 3x2 - 4 + 2x,find f(6)
a)
332
b)
116
c)
84
d)
-16
79.
Function notation
If f(t) = t2 - t,find f(-8)
a)
-72
b)
-56
c)
56
d)
72
80.

Find the domain and range of the function pictured here. Click graph to enlarge.

a)

Domain 8<x<6Domain\ -8<x<6 Range  3<y<8Range\ \ 3<y<8

b)

Domain  {7, 6, 5, 4, 3, 2, 1, 0, 1, 2, 3, 4, 5}Domain\ \ \left\{-7,\ -6,\ -5,\ 4,\ -3,\ -2,\ -1,\ 0,\ 1,\ 2,\ 3,\ 4,\ 5\right\} Range  {3, 4, 5, 6, 7, 8}Range\ \ \left\{3,\ 4,\ 5,\ 6,\ 7,\ 8\right\}

c)

Domain   8x6Domain\ \ \ -8\le x\le6 Range  3y8Range\ \ 3\le y\le8

d)

Domain  {7, 6, 5, 4, 3, 2, 1, 0, 1, 2, 3, 4, 5}Domain\ \ \left\{-7,\ -6,\ -5,\ 4,\ -3,\ -2,\ -1,\ 0,\ 1,\ 2,\ 3,\ 4,\ 5\right\} Range  {4, 5, 6, 7}Range\ \ \left\{4,\ 5,\ 6,\ 7\right\}

81.

Find the domain and range of the function pictured here. Click graph to enlarge.

a)


Domain 8<x<6Domain\ -8<x<6 Range  3<y<8Range\ \ 3<y<8

b)

Domain 8>x>6Domain\ -8>x>6 Range  3>y>8Range\ \ 3>y>8

c)

Range  3<y>8Range\ \ 3<y>8 Domain   8<x>6Domain\ \ \ -8<x>6

82.

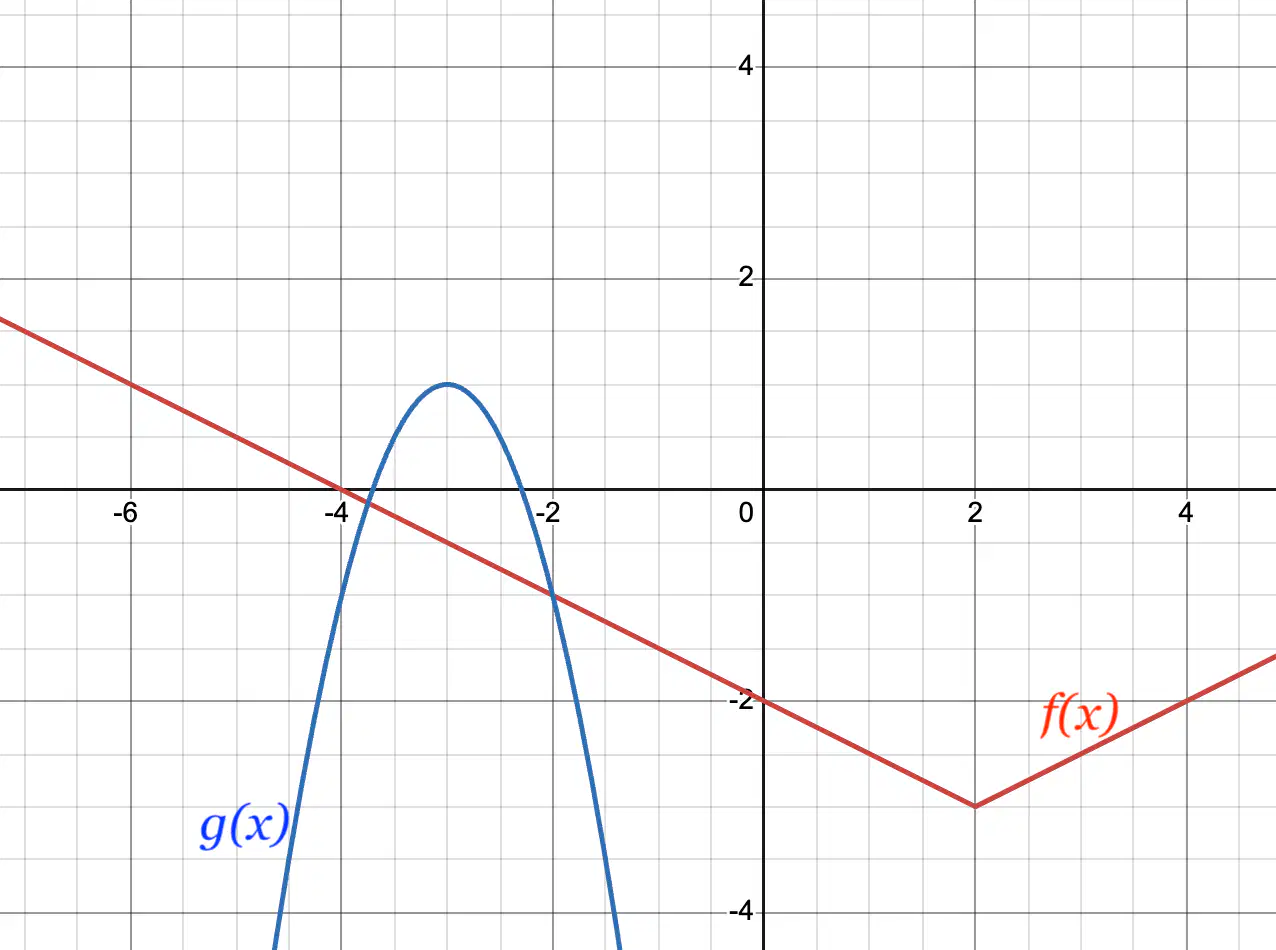
Select the correct symbol that fill the blank, which will make the mathematical statement true:

f(-3) __ g(-3)

a)

<

b)

>

c)

=

83.

Select the correct symbol that fill the blank, which will make the mathematical statement true:

f(-2) __ g(-2)

a)

<

b)

>

c)

=

84.

Select the correct symbol that fill the blank, which will make the mathematical statement true:

f(-4) __ g(-4)

a)

<

b)

>

c)

=