
 Worksheets
LINE GRAPH 4th Quarter
Total questions: 40
Worksheet time: 30mins

Annie recorded the amount of rain that fell each day. The results are shown in the line graph below. How many centimeters of rain fell on the third day?
2
3
4
7





Between which two years did the bear population remain constant or the same?
2004 and 2005
2001 and 2002
2005 and 2006
2000 and 2001

What was the lowest value recorded?
(a)
How many points are in the graph?
(a)
What does the vertical axis represent?
(a)
What does the horizontal axis represent?
(a)

What is the title of this graph?
(a)

The following line graph shows the number of students who graduated from college from 2009 to 2014.
How many students graduated in 2009?
How many students graduated in 2013?
(a)

Interpret the line graph:
1. A bookshop made a line graph of the number of books sold each week during a certain period.
Number of books sold in week seven?
Number of Books sold in week eight?
(a)
What are the parts of the line graph?
Labels and Middle
title, labels, scale, point, and line.
Upper, Down, scale, and point.
What is a line graph?
A line graph is another way of representing data.
A line graph is simply a line with a point.
A line graph has 10 parts.

In which month was the average temperature at lowest?
Jan
Feb
Mar
Apr
In which two consecutive months was the average temperature did not change?
Jan - Feb
Feb - Mar
Apr - May
May - Jun
In which month was the average temperature 30 degrees Celsius?
Jan
Mar
May
Jun

At what rate did the temperature decrease between the 20th and 25th minutes of the experiment?
10°C in 5 min
10°C in 10 min
5°C in 5 min
5°C in 10 min

A restaurant recorded the number of pizzas sold each month for one year. The data are shown in the graph below. During which month did the restaurant sell 40 pizzas?
March
May
July
August
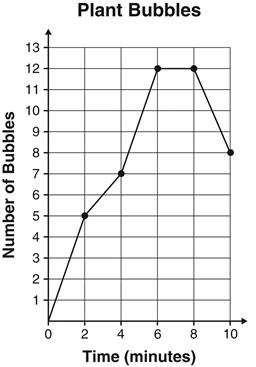
During an experiment, students counted the number of bubbles given off by water plants every 2 minutes during a 10-minute period. The results are graphed below.
At which two times were the same number of bubbles given off?
2 and 4 minutes
4 and 6 minutes
6 and 8 minutes
8 and 10 minutes
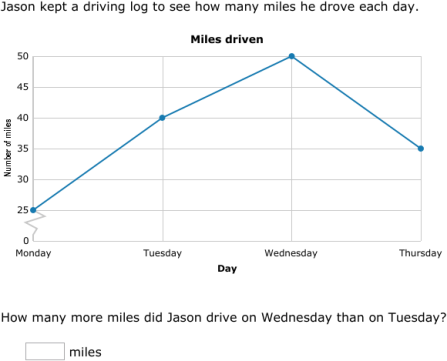

The graph shows the number of inches a plant grew each week.
Between which 2 weeks did the plant grow the MOST?
Week 1 and Week 2
Week 2 and Week 3
Week 3 and Week 4
Week 4 and Week 5
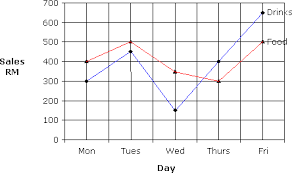
Annie recorded the amount of rain that fell each day. The results are shown in the line graph below. How many centimeters of rain fell on the third day?
2
3
4
7
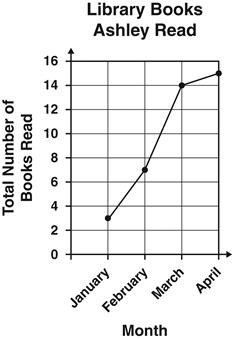
The graph below shows the total number of books Ashley had read by the end of each month for four months. During which month did Ashley read the fewest number of books?
January
February
March
April
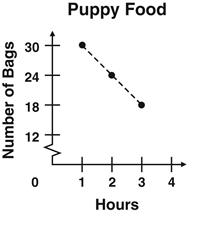
The number of bags of puppy food at a pet store decreases as the number of hours the store is open increases, as shown on the graph. At the fourth hour, how many bags of puppy food are left to sell?
10
12
15
18

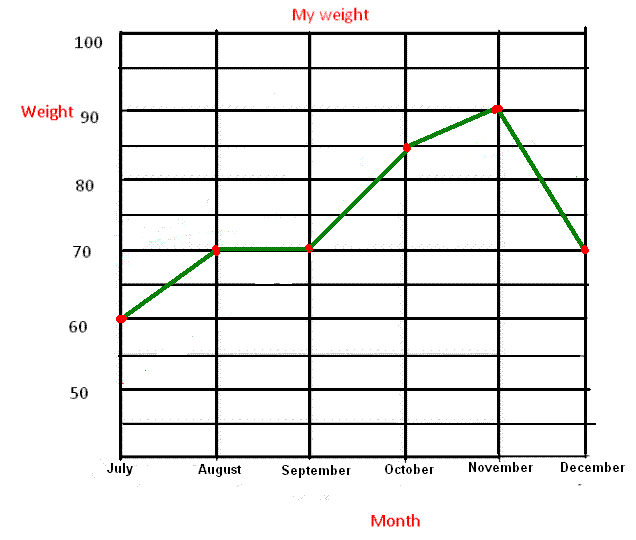
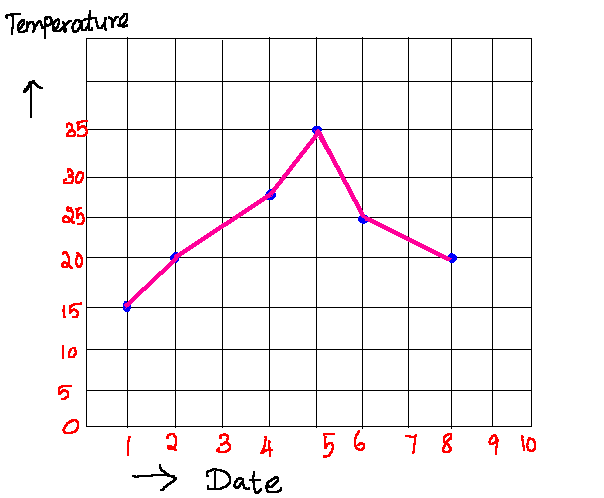

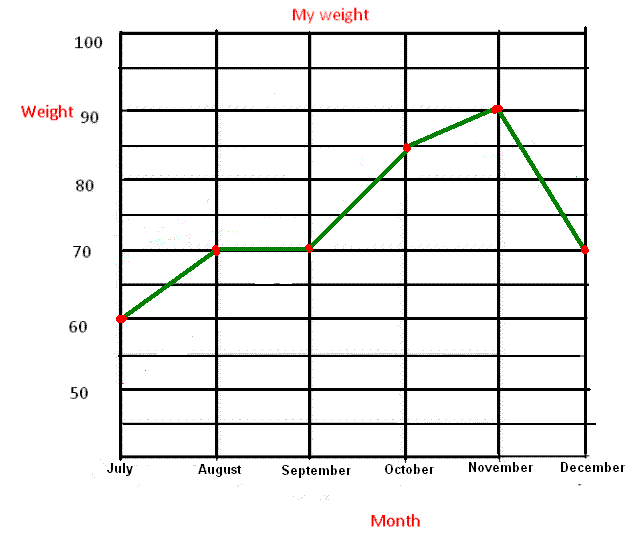
Between which two years did the bear population remain constant or the same?
2004 and 2005
2001 and 2002
2005 and 2006
2000 and 2001


