
 Worksheets
Graphing
Total questions: 17
Worksheet time: 1hrs 7mins
Name
Class
Date
1.

How many people had 3 pets?
a)
5
b)
7
c)
4
d)
3
2.
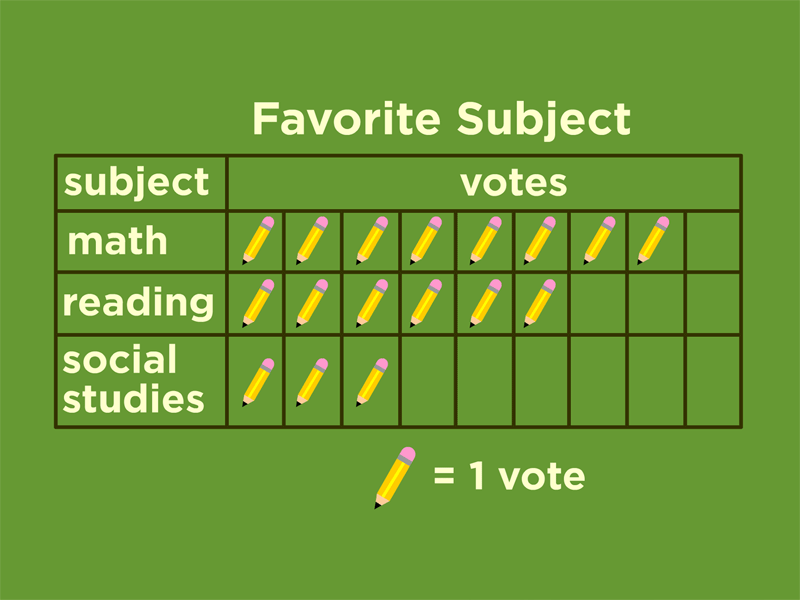
How many votes did reading receive?
a)
2
b)
4
c)
6
d)
8
3.
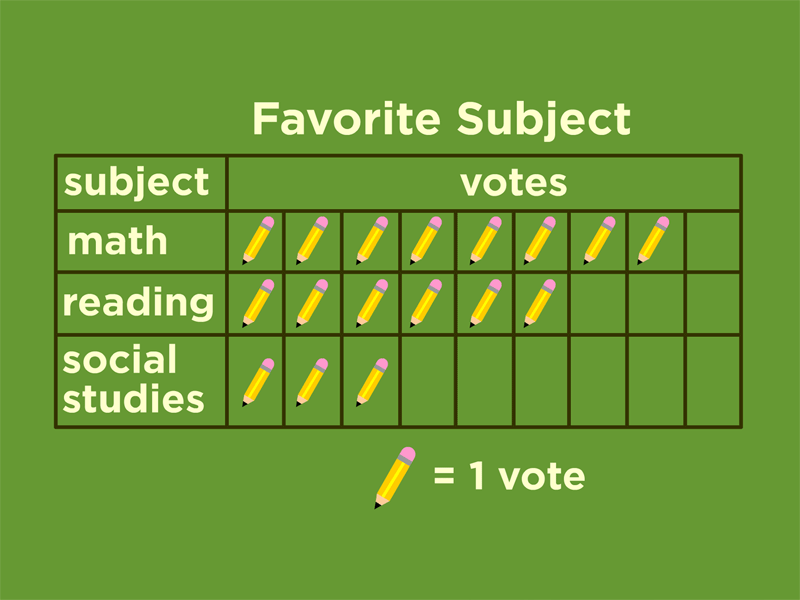
Which subject received the most votes?
a)
science
b)
reading
c)
social studies
d)
math
4.

Do fewer students own a cat or a dog?
a)
cat
b)
dog
5.

How many people voted for dogs?
(a)
6.

How many people voted for cat and fish altogether?
(a)
7.

Which fruit was the most favorite?
a)
Apple
b)
Orange
c)
Graph
d)
Banana
8.

Which lunch choice was the least favorite?
a)
Hot Dog
b)
Pizza
c)
Submarine Sandwich
d)
Hamburger
9.

How many children chose grapes?
a)
10
b)
7
c)
2
d)
6
10.

Which kind of pet do exactly five people have?
a)
snake
b)
cat
c)
dog
d)
fish
11.
Do fewer students own a cat or a dog?
a)
cat
b)
dog
12.

How many students in all voted for their favorite sport?
a)
21
b)
22
c)
23
d)
25
13.

How many students had more than 6 candy bars?
a)
5
b)
2
c)
3
d)
1
14.
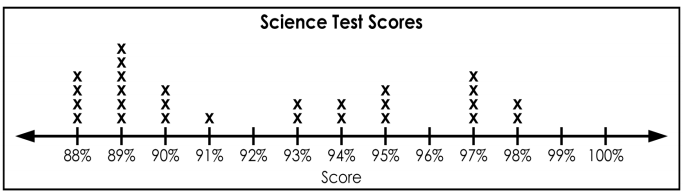
What is the highest score in the class?
a)
88%
b)
100%
c)
13
d)
98%
15.

True or false? The line plot shows 3 cars that are 6 inches in length.
a)
True
b)
False
16.

a)
b)
c)
d)
17.

Katie asked her friends their favorite food. Select the number of tally marks for Hot Dog.
a)
3
b)
4
c)
5
d)
6
100 %

