
Font size
 Worksheets
7th ACA Test 5-2 Review: Measurement & Data
Total questions: 12
Worksheet time: 8mins
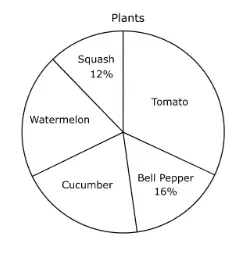
A garden contains 150 plants. The number of tomato plants is twice the number of bell pepper plants. The number of cucumber plants is the same as the number of watermelon plants. The remainder of the garden consists of squash plants. The circle graph shows the percentages of some of the types of plants in the garden. How many more tomatoes are there than squash?
48 more tomatoes
18 more tomatoes
30 more tomatoes
24 more tomatoes
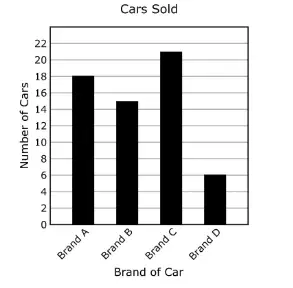
A salesperson made a bar graph of different brands of cars sold in a month. Based on the information in the graph, which car brands represented 30% of sales?
Brand A
Brand B
Brand C
Brand D
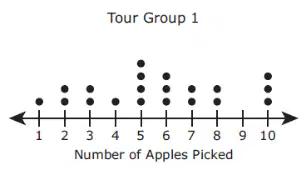
The dot plots show the numbers of apples picked by members of a Tour Group and an Orchard.
What percent of members picked 7 or more apples?
35%
20%
30%
25%
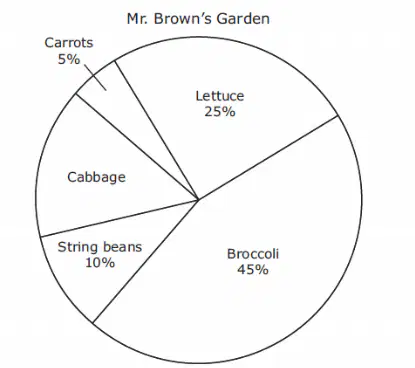
Mr. Brown planted a vegetable garden. The circle graph shows the kinds of vegetables he planted and the percentage of the area of the garden each kind of vegetable occupied. Mr. Brown's garden has an area of 160 square feet. Based on the circle graph, how many more square feet of land are used for lettuce than are used for cabbage?
15 square feet
16 square feet
25 square feet
10 square feet
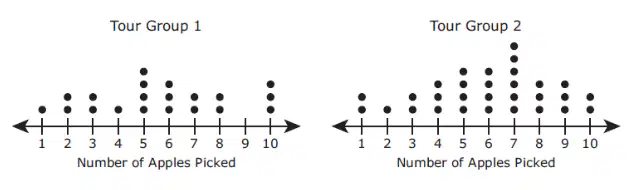
The dot plot shows the numbers of apples picked by members of two different tour groups at an orchard.
Which statement correctly compares these two data sets?
The median of the data is the same for both data sets
The mode of the data is the same for both data sets
The range of the data is the same for both data sets
The distribution of the data is symmetrical for both data sets
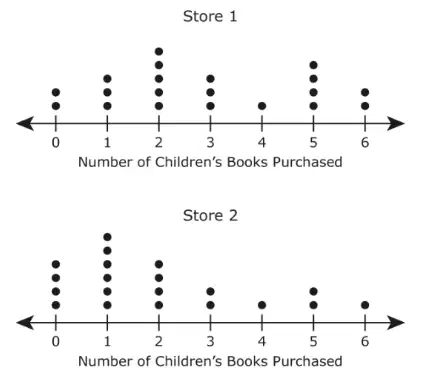
The dot plots show the numbers of children's books purchased by customers at two different bookstores on one day.
Which statement is supported by the information in the dot plots.
The mode of the data for Store 2 is greater than the mode of the data for Store 1
The range of the data for Store 1 is greater than the range of the data for Store 2
The mean of the data for Store 1 is greater than the mean of the data for Store 2
The median of the data for Store 2 is greater than the median of the data for Store 1
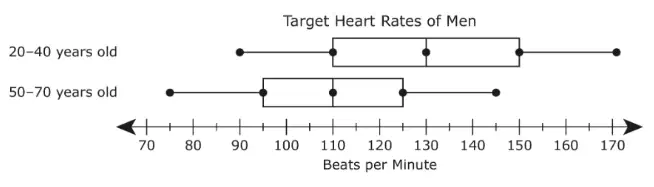
The box plots show the target heart rates of men 20-40 years old and men 50-70 years old. Which statement is best supported by the information in the box plots?
The range of the data for men 20-490 years old us less than the range of the data for men 50-70 years old
The median of the data for men 20-40 years old is less than the median of the data for men 50-70 years old.
The minimum target heart rate for men 20-40 years old is less than the minimum target heart rate for men 50-70 years old
The interquartile range of the data for men 20-40 years old is greater than the interquartile range of the data for men 50-70 years old.
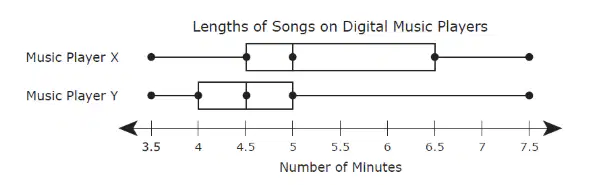
The box plot shows the lengths of the songs on two digital music players in minutes.
Which statement is best supported by the information in the box plots?
The interquartile range of the data for Music player X is equal to the interquartile range of the data for Music Player Y
The interquartile range of the data for Music Player X is greater than the interquartile range of the data for Music Player Y
The median length of the songs on Music Player X is equal to the median length of the songs on Music Player Y
The median length of the songs on Music Player X is less than the median length of the songs on Music Player Y
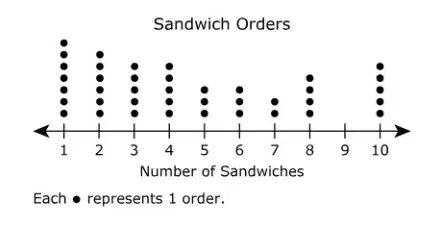
The owner of a deli recorded the number of sandwiches in each order for a random sample of orders that were placed on Monday. The data are presented in the dot plot.
The deli owner used this information to predict the number of sandwiches in each order that will be placed next Monday. Which inference about the number of sandwiches in each order is best supported by the information in the dot plot.
Most orders will be for 10 sandwiches
Fewer than 50% of the orders will be for 1 to 5 sandwiches
More orders will be for 1 or 2 sandwiches than for 9 or 10 sandwiches
More than 50% of the orders will be for 6 or more sandwiches
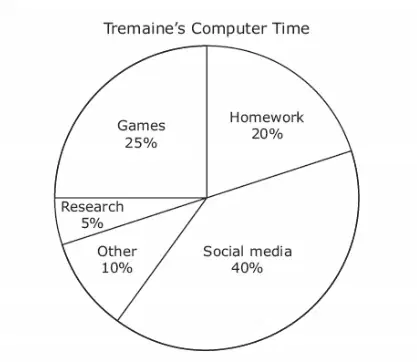
The circle graph shows how Tremaine divided his time on the computer last week.
Which statement is supported by this graph.
The amount of time spent on research and social media combined is less than the time spent on playing games and homework
The time spent on other is half the amount spent on social media
The amount of time spent on homework and social media combined is 6 times the amount of time spent on other
The amount of time spent on other and games is greater than the amount of time spent on social media
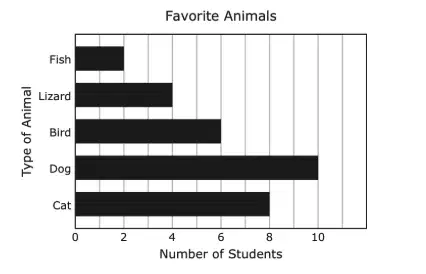
Students were surveyed to determine their favorite types of animals. The bar graph shows the number of students who selected each type of animal.
If 300 people are polled how many more people can be expected to select dog than lizard?
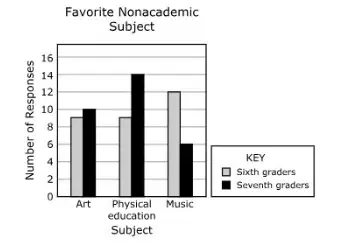
A teacher conducted a random survey during class, asking students to choose their favorite nonacademic subject. The results are shown in the bar graph.
Which inference about sixth and seventh graders is best supported by this information?
There are more 6th graders than 7th graders
The mode subject for seventh graders is physical education
More seventh graders like art than physical education and music combined
The percentage of students who prefer art or music is equal for 6th and 7th graders

