
NEW
Font size
 Worksheets
STAAR Review Day 12
Total questions: 21
Worksheet time: 36mins

A person walks 5 kilometers north and then 5 kilometers south. What is the total distance traveled?
0 km
5 km
10 km
15 km

A car travels 120 kilometers in 2 hours. What is the car's average speed?
50 km/h
55 km/h
60 km/h
65 km/h

If the man and the ball travels 90 m in 9 seconds, what is their average speed?
10 m/s
180 m/s
99 m/s
10 meters
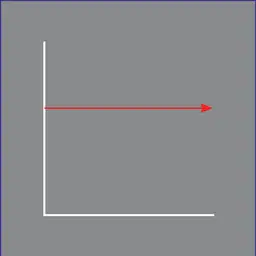
On a distance-time graph, what does a horizontal line represent?
Constant speed
Increasing speed
Decreasing speed
Zero speed

speed = speed / time
speed = Distance / time

Find the velocity of a plane that traveled 3000 miles west in 5 hours.
65 mph west
6 mph west
600 mph west
6000 mph west


Segment O-A The bus is _________________.
at rest
returning (to original position)
moving forward
Segment B-C The bus is _________________.
at rest
returning (to original position)
moving forward


A runner races in the 100 meter dash. It takes her 10 seconds to finish. What is her average speed?
10 m/s
1000 m/s
100 seconds
10 seconds


During which segment is the object increasing speed?
X
Y
Z
During which segment is the object decreasing speed?
X
Y
Z
During which segment is the object travelling at constant speed?
X
Y
Z

During which segment is the object moving at the fastest speed?
A
B
C
D
This graph shows decreasing speed. The moving object is decelerating.



