
 Worksheets
Online Quiz
Total questions: 60
Worksheet time: 3hrs 34mins
What is Measures of Position?
The median score is also the _____.
75th percentile
5th decile
3rd decile
1st quartile
When a distribution is divided into hundred equal parts, each score point that describes the distribution is called a ___________.
percentile
decile
quartile
median
The lower quartile is equal to ______________.
50th percentile
25th percentile
2nd decile
3rd quartile
Rochelle got a score of 55 which is equivalent to 70th percentile in a mathematics test. Which of the following is NOT true?
She scored above 70% of her classmates.
Thirty percent of the class got scores of 55 and above.
If the passing mark is the first quartile, she passed the test.
Her score is below the 5th decile.
In a 100-item test, the passing mark is the 3rd quartile. What does it imply?
The students should answer at least 75 items correctly to pass the test.
The students should answer at least 50 items correctly to pass the test.
The students should answer at most 75 items correctly to pass the test.
The students should answer at most 50 items correctly to pass the test
In the set of scores: 14, 17, 10, 22, 19, 24, 8, 12, and 19, the median score is _____.
17
16
15
13
In a 70-item test, Melody got a score of 50 which is the third quartile. This means that:
she got the highest score.
her score is higher than 25% of her classmates.
she surpassed 75% of her classmates.
seventy-five percent of the class did not pass the test.
The 1st quartile of the ages of 250 fourth year students is 16 years old. Which of the following statements is true?
Most of the students are below 16 years old.
Seventy-five percent of the students are 16 years old and above.
Twenty-five percent of the students are 16 years old.
One hundred fifty students are younger than 16 years.
In a group of 55 examinees taking the 50-item test, Rachel obtained a score of 38. This implies that her score is ______________.
below the 50th percentile
at the upper quartile
the 55th percentile
below the 3rd decile
Consider the score distribution of 15 students given below:
83, 72, 87, 79, 82, 77, 80, 73, 86, 81, 79, 82, 79, 74, 74.
The mean in the given score distribution of 15 students can also be interpreted as ______.
seven students scored higher than 79.
seven students scored lower than 79.
seven students scored lower than 79 and seven students scored higher than 79.
fourteen students scored lower than 79.
Which of these fractiles divides the data set into four equal parts?
Decile
Median
Percentile
Quartile
Which of these percentiles refer to the median?
P10
P25
P50
P75
Which of these percentiles refer to the lower quartile?
P10
P25
P50
P75
Which of these percentiles refer to the 1st decile?
P10
P25
P50
P75
If a data set consists of 24 scores, which position is the median?
5th
10th
12th
12.5th
What is the upper quartile in the distribution?
80, 85, 86, 90, 93, 95, 96
85
90
95
96
If the 3rd decile is found in the 18.4th position, where X18 = 25 and X19 = 30, what is the 3rd decile?
22.5
26
27
27.5
What is the percentile rank of 87?
Given: 70, 75, 80, 86, 87, 91, 94, 95, 98, 98
25th
40th
50th
75th
What percent of the students who took the exam have the lower scores than Jose if Jose's score is at the 95th percentile rank?
75
80
90
95
if Jose's score is at 95th percentile rank, what is the probability that a score randomly chosen is equal to or greater than Jose's score?
5
20
25
95

What is the size of the class interval?
10
9
8
7

What is the lower boundary of the 5th decile class?
30.5
40.5
50.5
60.5

What cumulative frequency below the 5th decile class?
11
21
34
42

Find the 5th decile.
44
45
46
47

What is the lower boundary of the 75th percentile class?
30.5
40.5
50.5
60.5

What cumulative frequency below the 75th percentile class?
11
21
34
42

The class interval containing the 1st quartile class.
A. 21 – 30 C. 41 – 50
B. 31 – 40 D. 51 – 60
21-30
31-40
41-50
51-60

Calculate the 1st quartile.
30
31
32
33

How do you interpret the third quartile ?
75% of the students of less than or equal to 55.
75% of the students of greater than or equal to 55.
75 % of the students of equal to 55.
75% of the students of not less than or equal to 55.
In the 2019 National Career Achievement Examination (NCAE), Aimee’s score in the Mathematics Ability Test is at 90th percentile rank. What does this mean?
Aimee’s score is 90 points.
Aimee's scored higher than 89% of the examinees.
Aimee's is the 90th in position among all the examinees.
Aimee's scored higher than the other 90% of the examinees.
Carl made a study on the sacks of rice produced every harvest season by the farmers in their town. If the third quartile of his data is 320 sacks, which of the following is true?
75% of the farmers in the town harvested greater than 320 sacks of rice each.
75% of the farmers in the town harvested less than 320 sacks of rice.
50% of the farmers in the town harvested less than 320 sacks of rice each.
25% of the farmers in the town harvested less than 320 sacks of rice each.
The 1st quartile of the ages of 250 Grade 10 students is 16 years. Which of the following statement is true?
Most of the students are below 16 years old.
Seventy – five percent of the student are 16 years old and above.
Twenty – five percent of the students are 16 years old.
One hundred fifty students are younger than 16 years.
The median of a set of data is the ___ .
1st quartile
30th percentile
50th percentile
6th decile
A researcher has collected the following sample data: 5, 12, 6, 8, 5, 6, 7, 5, 12, 4
Calculate the 5th decile.
A
5
6
7
9
A year ago, Matthew began working at a computer store. His supervisor asked him to keep a record of the number of sales he made each month. The following data set is a list of his sales for the last 12 months: 34, 47, 1, 15, 57, 24, 20, 11, 19, 50, 28, 37. Calculate the 25th percentile.
A. 11 B. 15 C. 20 D. 24
11
15
20
24
What are the three measures of position?
Quartile, Decile, and Percentile
Mean, Median, and Mode
Decile, Quantile, Percentile
This measures of position is distributed by ten equal parts?
Quartile
Decile
Percentile
This measures of position is distributed by four equal parts?
Decile
Quartile
Percentile
This measures of position is distributed into hundred equal parts?
Decile
Percentile
Quartile
2nd Quartile, 5th Decile, and 50th Percentile are also known as?
Mean
Median
Mode
What is the 1st step in getting the measures of position?
Make a conclusion.
Determine the value of quantile based on its computed position.
Arrange the data into ascending orders or least to highest.
The MENDENHALL AND SINCICH METHOD rule for getting the lower quartile.
Round up or Round off
Round down or stay
The MENDENHALL AND SINCICH METHOD rule for getting the upper quartile.
Round up or Round off
Round down or stay
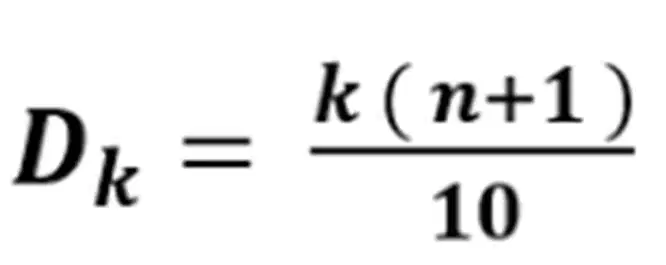
The shown formula is for getting what measures of position?
Quartiles
Deciles
Percentiles
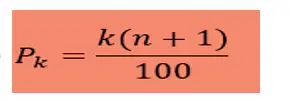
The shown formula is for getting what measures of position?
Decile
Quartile
Percentile
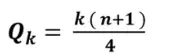
The shown formula is for getting the what measures of position?
Decile
Quartile
Percentile
The lower quartile is equal to
50th percentile
25th percentile
2nd decile
3rd quartile
the difference between the upper-class limit and the lower-class limit
class interval
lower class boundary
cumulative frequency
Range
To get the lower class boundary you will subtract _____ to the lower limit
0.3
0.4
0.5
0.6
The following are measures of central tendency except..
MEAN
QUARTILES
MEDIAN
MODE
Quartile, decile and percentile are examples of _________.
Measures of variability
Measures of Position
Measure of Central Tendency
Measure of Statistics
These are the score points which divide a distribution into ten equal parts.
Median
Quartile
Decile
Percentile
Interquartile Range is equal to the difference from ___and ___.
Q2 and Q1
Q1 and Q3
Q3 and Q2
Q3 and Q1
Given the following set of numbers: 10, 15, 20, 25, 30, 35, 40, 45, 50. What is the 5th Decile?
25
30
35
40
The following is equal to the Median EXCEPT.
Q2
D5
P75
P50

Refer to the table as shown, what is the class width/size in the given table?
3
4
5
6
Refer to the table as shown. If you are going to solve for the 3rd quartile of the grouped data, what lower boundary are you going to use?
115.5
109.5
104.5
97.5
It is the difference between the upper quartile & the lower quartile.
deciles
quartiles
percentiles
Interquartile Range
If the first quartile of the given data is 20 what does it mean?
This means that 25% of the students scored lower or equal to 20.
This means that 15% of the students scored lower or equal to 20.
This means that 10% of the students scored lower or equal to 20.

