
NEW
Font size
 Worksheets
Data Analysis and Interpretation Quiz
Total questions: 10
Worksheet time: 5mins
What is the main purpose of data analysis in research?
To manipulate data for a desired outcome
To organize and interpret data for meaningful conclusions
To replace raw data with personal opinions
To ignore outliers and inconsistencies
Which of the following is NOT a method of presenting data?
Tables
Graphs
Charts
Hypotheses
A research dataset contains student test scores. Which type of data is this?
Qualitative
Categorical
Quantitative
Nominal
What is the most appropriate way to visually represent trends in students’ favorite school subjects over time?
Line graph
Pie chart
Scatter plot
Histogram
Which of the following best describes data interpretation?
Collecting raw data for a study
Explaining the meaning and implications of analyzed data
Sorting and filtering data without drawing conclusions
Converting qualitative data into numerical values
A study collected survey responses on students' study habits (e.g., "always," "sometimes," "never"). How should this data be classified?
Nominal
Ordinal
Ratio
Interval
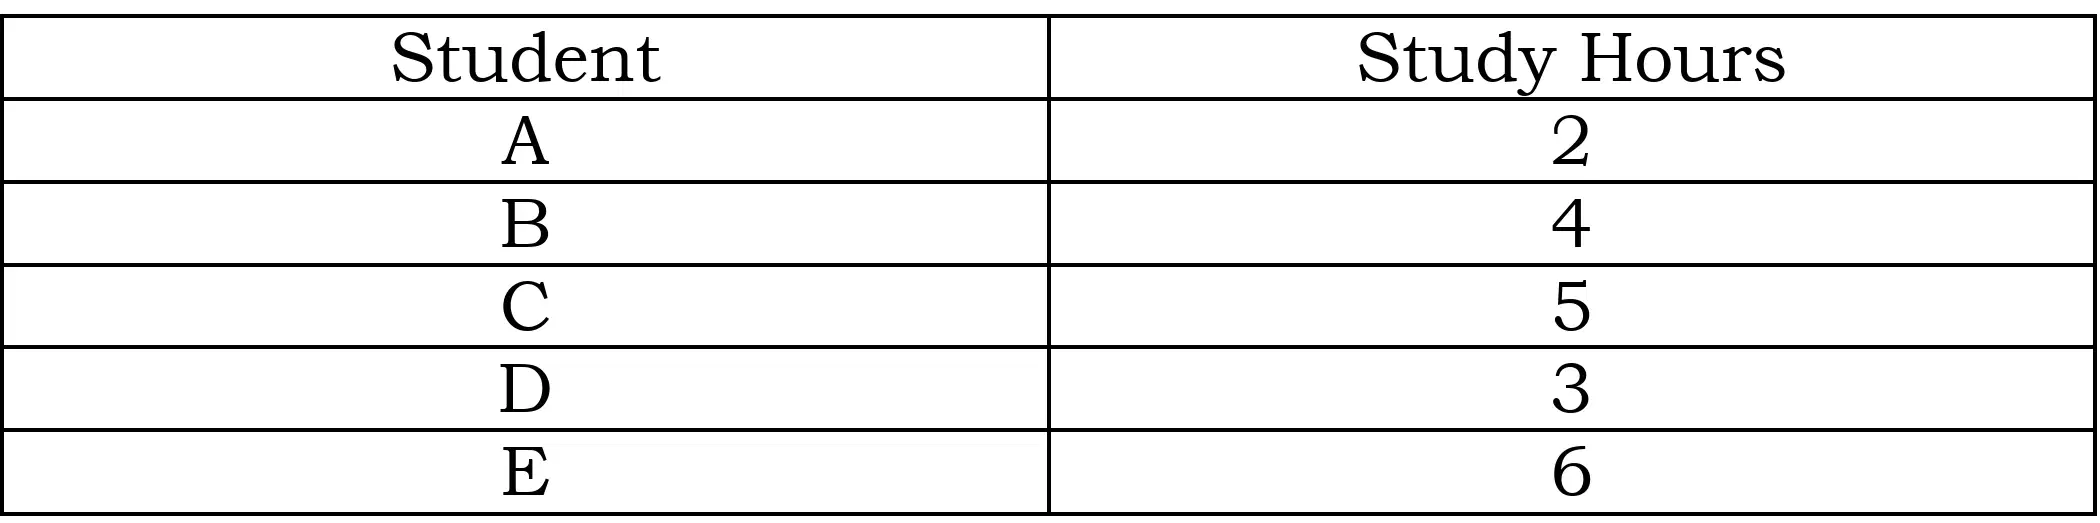
A researcher collected data on the number of hours students spend studying each day. Which of the following graphs would be the BEST way to represent this data?
Pie Chart
Line Graph
Bar Graph
Tabular form
If a researcher wants to show the percentage distribution of students’ preferred learning styles, which visual representation is the most suitable?
Line Graph
Pie Chart
Bar Graph
Table
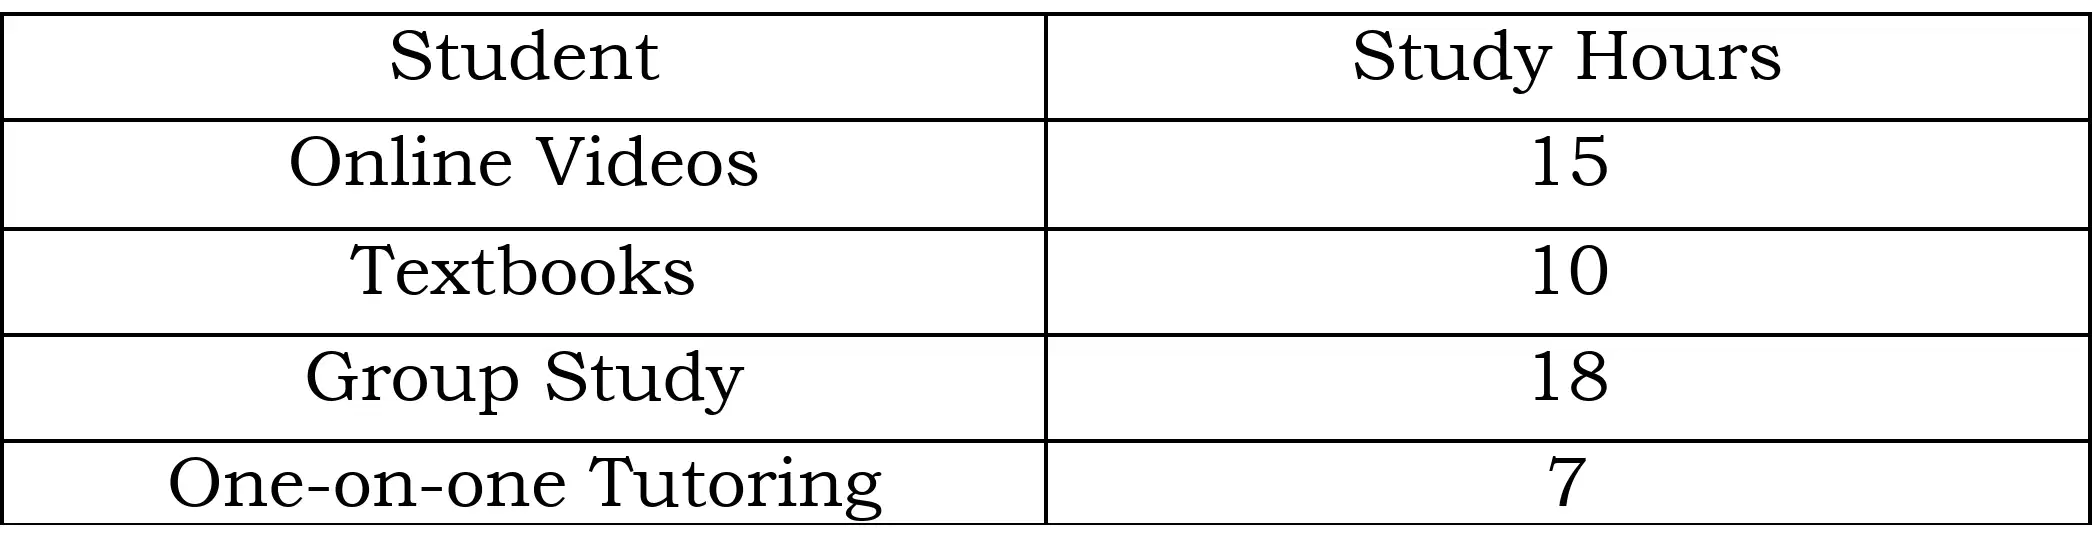
The data is a set of survey responses from students about their preferred learning methods. Which of the following conclusions can be drawn from the data?
Group study is the most preferred method among students.
Online videos are the least preferred method.
All students prefer textbooks over online videos.
One-on-one tutoring is the most effective learning method.
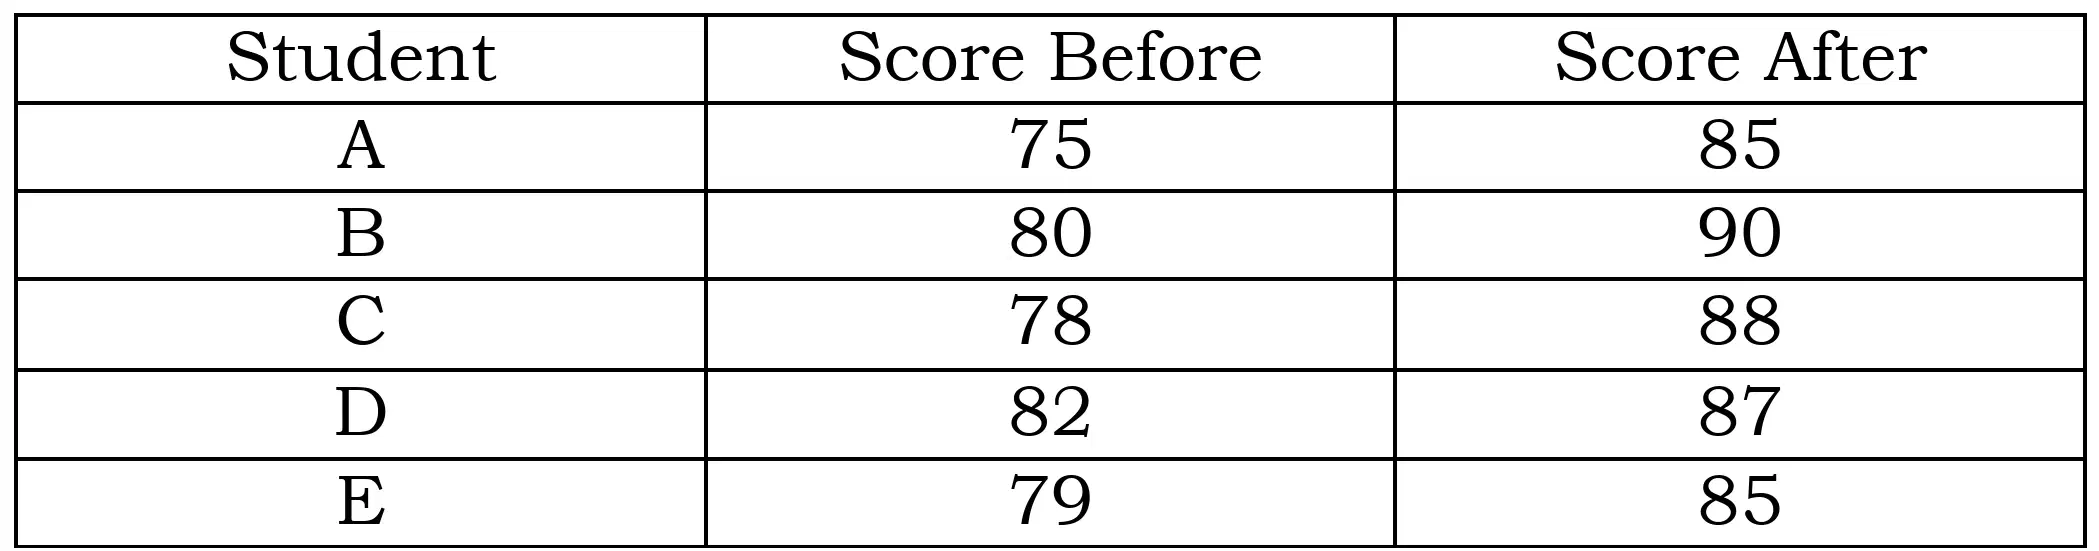
A researcher collected the following data on students’ test scores before and after attending review sessions. What conclusion can be drawn from the data?
Review sessions had no effect on student scores.
Most students’ scores improved after attending the review sessions.
The data is unreliable because the scores are too close.
There is no pattern in the scores.

