
Font size
 Worksheets
AP Statistics - χ2 review
Total questions: 10
Worksheet time: 7mins
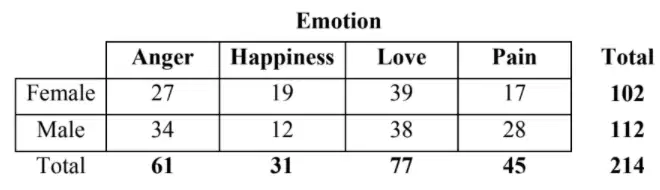
Do male and female children respond differently to colors? A study of color association in children asked separate random samples of male and female fourth-graders what emotion they associated with the color red. Here are the results for each group. Which of the following would be the appropriate null hypothesis for this test?
The distribution of emotional associations with the color red is the same for male and female fourth-graders.
Gender is dependent upon emotional association with the color red.
Emotional associations with the color red are independent of gender.
The number of observations in each cell is the same for each emotional association.
25% of all fourth graders associate the color red with each of the four listed emotions.
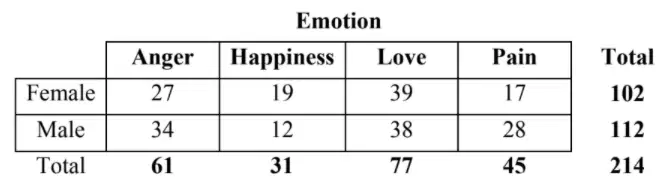
Do male and female children respond differently to colors? A study of color association in children asked separate random samples of male and female fourth-graders what emotion they associated with the color red. Here are the results for each group.
Under the assumption that the null hypothesis is true, which of the following represents the expected count for female children who associate the color red with love?
39
10277⋅214
21477⋅102
7739⋅102
214392
Do male and female children respond differently to colors? A study of color association in children asked separate random samples of male and female fourth-graders what emotion they associated with the color red. Here are the results for each group.
What are the degrees of freedom?
(a)
Do male and female children respond differently to colors? A study of color association in children asked separate random samples of male and female fourth-graders what emotion they associated with the color red. Here are the results for each group.
Under the assumption that the null hypothesis is true, which of the following represents the expected count for female children who associate the color red with love?
What is the value of the test statistic (χ2)?
Round to 4 decimal places.
(a)
Is the accident rate for some car colors different than for other car colors? An insurance company selects a random sample of cars that it insures and records their color (using five categories: white, silver, black, red, or “all others”) and whether or not they have been involved in an accident in the last three years. They perform a chi-square test of association and obtain a test statistic of χ2 = 8.474. What is the p-value of the test? Type your answer as 0. (a) and round to 4 decimal places.
Is the accident rate for some car colors different than for other car colors? An insurance company selects a random sample of cars that it insures and records their color (using five categories: white, silver, black, red, or “all others”) and whether or not they have been involved in an accident in the last three years. They perform a chi-square test of association and obtain a test statistic of χ2 = 8.474, which yields a P-value of 0.0757. Using a significance level of α = 0.05, which of the following is the appropriate conclusion for this test?
Reject H0: there is convincing evidence of an association between car color and proportion
of cars involved in accidents.
Accept H0: there is convincing evidence that car color and proportion of cars involved in
accidents are independent.
Reject H0: there is insufficient evidence to establish an association between car color and
proportion of cars involved in accidents.
Fail to reject H0: there is insufficient evidence to establish an association between car color
and proportion of cars involved in accidents.
Fail to reject H0: there is convincing evidence that car color and proportion of cars involved
in accidents are independent.

A well-known chewing gum maker wants to determine if any of its four flavors of gum are more popular than the others. A random sample of 80 people who say they chew gum regularly is asked to identify their favorite flavor of gum. Here are the results.
Which of the following are conditions that must be met in order to test this hypothesis using a chi-square test?
I. If p = proportion of gum-chewers in the population, then np ≥10 and n(1 - p) ≥ 10.
II. All expected cell counts are greater than 5.
III. The sample size of 80 is less than 10% of the targeted population.
I and II only
II and III only
I and III only
II only
I, II, and III

A statistically-minded toll collector wonders if drivers are equally likely to choose each of the three lanes at his toll booth. He selects a random sample from all the cars that approach the booth when all three lanes are empty, so that the driver’s choice isn’t influenced by the cars already at the booth.
Here are his results:


A die was rolled 30 times with the following results:
A goodness-of-fit test is to be used to test the null hypothesis that the die is fair. At a significance level of 1%, the value of the chi-square and the decision reached is
12.8; fail to reject the null hypothesis
12.8; reject the null hypothesis
3.89; fail to reject the null hypothesis
3.89; reject the null hypothesis
6.9; fail to reject the null hypothesis
A company claims it audits its employees’ transactions based on their job level. For entry-level positions, the company claims that 50 percent get a basic audit, 30 percent get an enhanced audit, and 20 percent get a complete audit. The company tests this hypothesis using a random sample and finds χ2 = 0.771 with a corresponding p-value of 0.68. Assuming that conditions for inference were met, which of the following is the correct interpretation of the p-value?
There is a 68 percent chance of obtaining a chi-square value of at least 0.771.
There is a 68 percent chance that the company’s claim is correct.
If the null hypothesis were true, there would be a 68 percent chance that the company’s claim is correct.
If the null hypothesis were true, there would be a 68 percent chance of obtaining a chi-square value of 0.771.
If the null hypothesis were true, there would be a 68 percent chance of obtaining a chi-square value of at least 0.771.

