
 Worksheets
Review Day 2 - Tower
Total questions: 200
Worksheet time: 50hrs 0mins
R: {0, 1, 2, -4}
R:{-4, -3, 1}
R:{1, -3, -4}
R: {1, -3, -4, 1}

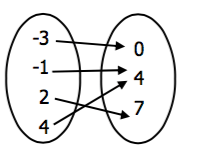


What is the Range?
y ≥ 6
−∞<y≤6
-10 ≤ y ≤ 6
-10 ≤ x ≤ 6
(9, -2) (4, 3) ( 8, 10) ( -4, 8)

-87 = -3 (3r + 8)
8
7
20
5



g(x) = 5x-7
Find f(x)+g(x).
g(x) = x-9
Find f(x)-g(x).
g(x) = x - 2
Find f(g(5))
When f(x) = 2x and g(x) = x2 + 3 , find f(g(x)).
x2 + 2x + 3
4x2 + 3
2x2 + 3
2x2 + 6


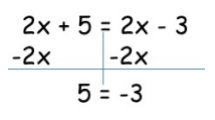
How many solutions?

The lines graphed on the coordinate grid each represent an equation. Which ordered pair represents a solution to both equations?
(2, 2)
(0, 4)
(0, 0)
((4, 0)


y < 2
y < 2
y < 2
y < -2

y < x + 4
y ≥ x + 4
y ≥ x + 4
y ≥ x + 3
Carlos works at a movie theater selling tickets. The theater has 300 seats and charges $7.50 for adults and $5.50 for children. The theater expects to make at least $2000 for each showing
7.5x+5.5y≥2000
7.5x+5.5y≥2000
7.5x+5.5y≤2000
7.5x+5.5y≤300


Solve the system of inequalities by graphing.


Solve the system of inequalities by graphing.


translation up 1
f(x) + 1
f(x - 1)
f(x) - 1
f(x + 1)
State the transformations of the function from the Parent Function
g(x)=(x−2)2+3
Shift Left 2
and
Shift Down 3
Shift Right 2
and
Shift Up 3
Shift Right 2
and
Shift Down 3
Shift Left 2
and
Shift Up 3
A=10(1.01)3
Samantha's hair was known to grow very rapidly. It began at a length of 6 in and grew at a rate of 14% a week.

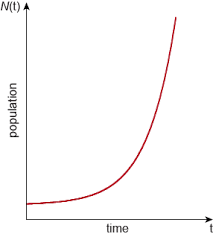
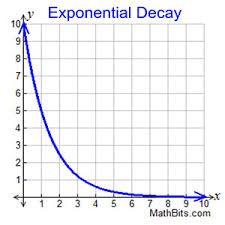
Which the following graphs shows an exponential decay equation?


Given this regression information in Desmos, what is the line of best fit equation?
y = 55.5x + 3.28
y = 55.5x - 3.28
y = 3.28x + 55.5
y = -3.28x + 55.5

Given this regression information in Desmos, describe the type of correlation.
Strong positive
Weak positive
Strong negative
Weak negative

Given the following Scatter Plot, select the option that is most likely the r value.
r=−.45
r=−.981
r=.728
r=.12
r = -0.3 is considered to have...
moderate negative correlation
weak negative correlation
no correlation
strong negative correlation

Which scatter plot diagram shows the strongest positive correlation?
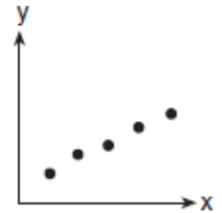
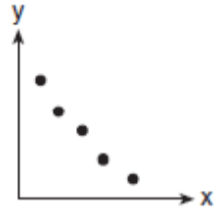
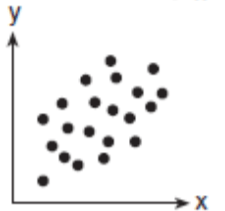
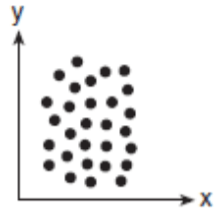

What is the equation of the line of best fit?
y= 2x+3
y=3x+2
y= 21x +3
y= −21x +3

Which line is the best line of best fit?
a
b
c
i don't see any lines


What percentage of the data is between 90 and 140?
25 %
50%
75%
100%

What percent of the data is between 30 and 35 on the number line?
25%
50%
75%
100%

Which car club has the higher median?
Cruisers
Car Hops
Neither. Can't determine median from the graph.

What percentage of the data is between 40 and 90?
25 %
50%
75%
100%
What is the upper quartile of this data?
40
90
100
140
150

(1, -19) and (-2, -7)

Students recorded the amount of minutes they spend watching TV. Using the box plot shown above, what is the first quartile?
30
24
60
78




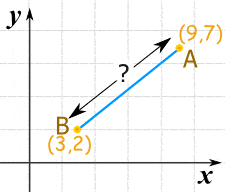
What is the distance between AB
0
8
9
7

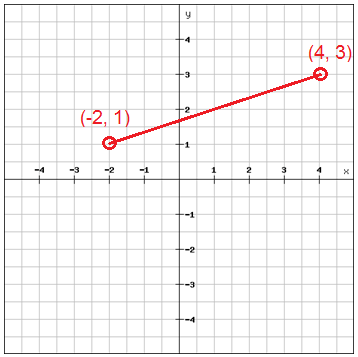


Select the explicit rule that represents the sequence.
an = 14(-3)(n - 1)
an = 3 + (n - 1)(14)
an = 14 + (n - 1)(-3)
an = -3 + (n - 1)(14)
Find the 35th term in the arithmetic sequence: -10, -14, -18, -22, ...
(Hint: Write the explicit rule first, then use it to solve)
-216
-148
-146
-150
Find the 22nd term of the following sequence:
5, 8, 11, ...
(Hint: Write the explicit rule first, then use it to solve)
14
68
63
71

Select the explicit rule that represents the sequence.
an = 6 + 5(n - 1)
an = 4 + 6(n - 1)
an = 6 - 4(n - 1)
How many FACTORS are there in this equation?
B = 3r2π
5
2
3
4
How many FACTORS are there in this equation?
V=31πr2h
5
2
3
4

What is the equation of the graph?
y<2x−4
y<21x−4
y>2x−4
y>21x−4

Which point is not a solution?
(1, 6)
(-1, 1)
(3, -2)
(5, 0)
Is (1,1) a solution to this system of inequalities?
5x+1>y
3x−6y≤6
yes
no
no solution
y = 2x - 3
x = 2y - 3
x = 3 - 2y
x = 33 - 2y
13.5x - 13y = 6
x - y = 6
3x + 7y = 13.5
3x - 7y = 13.5
3S + 4A = 1740
4S + 3A = 1740
3S + 4A = 530
4S + 3A = 530
t = 3n + 8
n = 3t + 8
t = 3n - 8
t = 3n + 54

y=mx+b
C = 2πr, for r
2πC=r
Given d=rt, solve for r.
r=dt
t = rd
d=tr
r=td
w=em+y Solve for y
y=w−em
y=w+em
y=emw
y=wem
p=ax+g Solve for x
x=ap+g
x=ap−g
x=ap+g
x=ap−g

How can we get x by itself?
Add k
Subtract k
Multiply by k
Divide by k
Solve for y:
5x + y = 16
y = -5x + 16
y = 5x + 16
y = 5y - 16
y = -5x - 16
Solve IR = V for R.
R = IV
R = I/V
R = V/I
R = V - I

Solve for x:
x = yb - v
x = by - v
x = by + v
x = vy + b
Solve for w
P = 2l + 2w
w=l2P
w=22l+P
w=2l+P
w=2P−2l


8
-24
24
-22


Parallel lines have the ______ slope.
Different
Same
Negative
Opposite Reciprocal
Perpendicular lines have the ______ slope.
Different
Same
Negative
Opposite Reciprocal
m = 3/4
m = 4
When is the mean a better measure of central tendency?
When the data is categorical
When the data is missing values
When the data is skewed
When the data is normally distributed or symmetrically distributed.
When is the median a better measure of central tendency?
When the data set is small
When the data set does not contain outliers or extreme values
When the data set is normally distributed
When the data set contains outliers or extreme values, or when the data set is not normally distributed.
What happens to the mean when an outlier is added to the data set?
The mean becomes equal to the outlier.
The mean becomes the average of all the data points.
The mean remains unchanged.
The mean is affected and tends to be pulled towards the outlier.
What happens to the median when an outlier is added to the data set?
The median will not be affected by the outlier.
The median will always decrease.
The median may shift depending on the value of the outlier.
The median will always increase.

Skewed up box
Skewed to the left
Skewed to the right




Describe the shape of the graph.
Symmetrical
Skewed
Uniform
If a distribution is perfectly symmetrical, what can we say about the relationship between the mean and median?
Mean > Median
Mean < Median
Mean = Median
Cannot be determined
In a negatively skewed distribution, the mean is usually:
Greater than the median
Less than the median
Equal to the median
Cannot be determined
In a positively skewed distribution, the mean is usually:
Greater than the median
Less than the median
Equal to the median
Cannot be determined

Which statement is best supported by the graph?
The shape of the graph is symmetrical, so the mean and median are equal.
The shape of the graph is asymmetrical, so the mean and median are equal.
The shape of the graph is symmetrical , so the mean an median are NOT equal.
The shape of the graph is asymmetrical, sot eh mean and median are NOT equal.

The value of the larger median for the two groups is the ______________.
Indoor median is 3.82
Outdoor median is 7
Outdoor median is 6.93
Indoor median is 4.5
Set 1-Standard Deviation=3.1
Set 2-Standard Deviation=4.9
Set 3-Standard Deviation=1.7
Set 4-Standard Deviation=3.2
Which set of data probably has the points closest to the mean?
What percentage of the scores is contained in the box in a boxplot?
34%
50%
68%
100%



What are the correct expressions for using the IQR to determine if there is an outlier that is a lot less and a lot greater than the other values. Hint: Choose 2 expressions.
Q1 - 1.5(IQR)
Q3 - 1.5(IQR)
Q1 + 1.5(IQR)
Q3 + 1.5(IQR)

Which class period has less variability in their test scores? Approximate the Interquartile Range (IQR) for that class period.
1st period; IQR≈15
2nd period; IQR≈25
1st Period; IQR≈37
2nd Period; IQR≈11
Data Set A: The mean is 43.5 and the MAD is 3.7.
Data Set B: The mean is 12.8 and the MAD is 4.1.
Which data set shows greater variability?
Data Set A
Data Set B
Both data sets have the same variability.
Number of steps taken per day and number of kilometers walked per day. r=.92
strong positive
strong negative
weak positive
weak negative
Car weight and distance traveled using a full tank of gas. r=−.86
strong positive
strong negative
weak positive
weak negative
Score on science exam and number of words written on the essay question. r=.28
strong positive
strong negative
weak positive
weak negative
Average time spent listening to music per day and average time spent watching TV per day. r=−.17
strong positive
strong negative
weak positive
weak negative


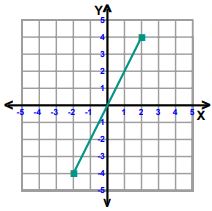
What is the domain in Interval notation?
[ -2 , 2 ]
[ 4 , -4 ]
-2 ≤ x ≤ 2
4 ≥ y ≥ -4

What is the input?
0, 4, 10, 12
1, 2, 4, 5, 10, 12
0, 4, 10, 4, 12
1, 2, 5
What is the output?
0, 4, 10, 12
1, 2, 4, 5, 10, 12
0, 4, 10, 4, 12
1, 2, 5

The following sets can be used to fill the blank spaces in the domain column.
Which set will make this table a Function.
Give the range of the set of ordered pairs: (2, 11), (9, -3), (7, 21), (-8, 6)
{2, 9, 7, -8}
{11, -3, 21, 6}
-8 < x < 9
-3 < y < 21
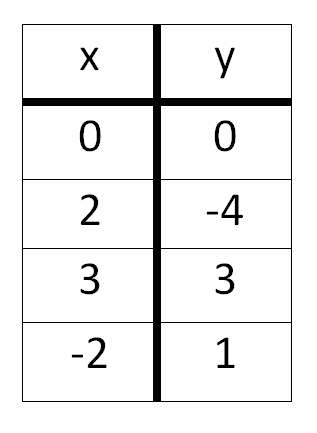
What is the range of the table?
{-4, 0, 1, 3}
{-2, 0, 2, 3}
{-4, -2, 0, 1, 2, 3}
{ (0, 0), (2, -4), (3, 3), (-2, 1) }
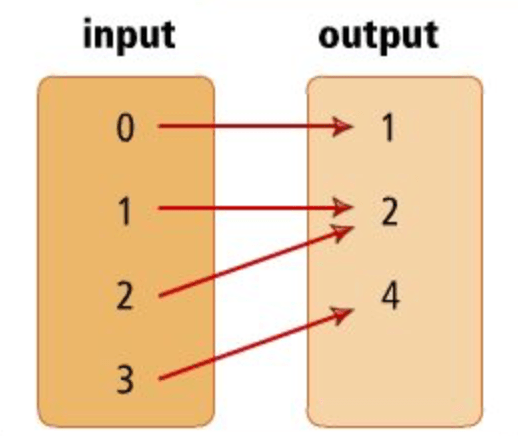
What is the range of the mapping?
{1, 2, 4}
{0, 1, 2, 3}
{0, 3}
{1, 4}

What is the domain?
-4 < x ≤ 5
-4 ≤ x < 5
-3 < y < 3
-3 ≤ y ≤ 3


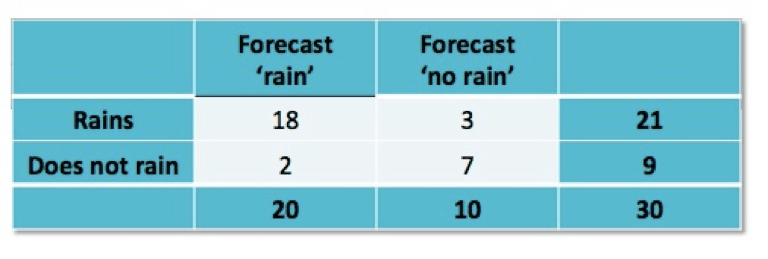


How many adults took this survey?
52
41
93
131

How many children prefer vanilla ice cream?
78
131
26
105

How many medium sized t-shirts were ordered?
9
1
10
2

How many total people participated in this survey
145
80
85
290


The equation of the line in the given graph is
y = 0.467x + 0.417
Which choice is the best interpretation of the slope?
For every additional minute the distance increases 0.417
For every additional mile the minutes increase 0.467
For every additional minute the distance decreases 0.467
For every additional minute the distance increases 0.467

Based on the graph estimate how far you drive in 20 minutes.
20 miles
0 miles
9 miles
5 miles

Use the data to calculate the correlation value
-.9
0.74
0.09
-0.09

Use the data to create a regression line. (Ti84+)
y = - 0.0014x + 81.12
y = - 14x + 81.12
y = 14x + 81.12
y = - 0.14x + 81.12

The data sets show the test scores of a group for the last two tests.
Test 1: {75, 75, 85, 80, 65, 70, 65} Test 2: {95, 85, 85, 90, 90, 95, 100}
Which data set had the SMALLER standard deviation?
Test 1 with a standard deviation of 6.9
Test 2 with a standard deviation of 6.9
Test 1 with a standard deviation of 5.2
Test 2 with a standard deviation of 5.2
What is the standard deviation for the data given:
{5, 10, 7, 12, 0, 20, 15, 22, 8, 2}
6.89
10.1
7.26
9

What is the interquartile range?
22.5
35
60
50

Solve the system of inequalities by graphing.
(-3, 0) is a solution of the given system.
y ≤ x + 4
y ≥ 2x - 6

Solid or dashed line? Y ≥
Solid
Dashed

Write the inequality in slope intercept form. Do not type spaces.
(a)

Write the inequality in slope intercept form. Do not type spaces.
(a)
Which graph represents
y<−21x+3


Which graph represents
y≤2x−1


Which points are solutions to the system of inequalities. Select all that apply.
(2,2)
(0,0)
(4,1)
(0,1)
(3,-1)
Kate is selling bracelets and earrings on Etsy to make money for summer vacation. The bracelets (x) cost $2 and earrings (y) cost $3. She needs to make at least $100, but can only make up to 40 pieces of jewelry. Which inequalities represent this situation?
2x + 3y > 100
x + y ≤ 40
100x + 2y > 3
x + y ≤ 40
100x + 40y > 100
3x + 2y ≤ 40
3x + 2y > 100
x + y ≤ 40


y>3
y≥3
y<3
y≤3


Which system of linear inequalities is represented by the graph?
y ≤ 2x-1
y > -2x+3
y > 2x-1
y ≤ -2x+3
y < 2x-1
y ≥ -2x+3
y ≤ 2x-1
y > 2x+3

Which of the following is a solution to the systems of inequalities?
(-1, -3)
(3, 0)
(-2, 2)
(4, 1)

Which of the following is a solution to the systems of inequalities?
(0, 0)
(1, 1)
(-4, -2)
(4, -2)


Which of the following linear inequalities represents the graph?
y≥3
x≥3
y≤3
y<3
Identify the graph represented by the following system of inequalities.
2x - y > 4
4x + 2y < 6



