
Font size
 Worksheets
Date CA Review
Total questions: 121
Worksheet time: 9hrs 19mins

Describe the shape of the graph
Uniformed
Symmetrical
Skewed Right
Skewed Left

What is the shape of the distribution?
Skewed Left
Skewed Right
Symmetric
Curved Up Shape

Describe the shape of the graph
Skewed right
Skewed left
Uniform
Symmetrical

What is the shape of the distribution?
Skewed Left
Skewed Right
Symmetric
Uniform

What is the shape of the distribution?
Skewed Left
Skewed Right
Symmetric
Uniform
What does it mean when the shape of data is symmetric?
They all have the same or similar height
The data is slightly skewed to the right
The data on the left is similar to the data on the right
The data is slightly skewed to the left
90, 100, 95, 85, 60, 80
5, 15, 10, 20, 15, 10, 15
5, 15, 10, 20, 15, 10, 15


What does 66 represent in the box plot?
Lower Extreme
Median
Mean
Upper Extreme

How many people spent from $30 to $39.99?
80
60
45
15
What is the IQR of the box plot, in feet?
41 foot
21 foot
32 foot
131 feet
The data shows the ages of teachers at a school.
33, 25, 42, 25, 31, 37, 43, 29, 38, 25, 25, 29, 31, 33, 37, 38, 42, 43
What is the median of the data?
25
31
33
37
The data shows the ages of teachers at a school.
33, 25, 42, 25, 31, 37, 43, 29, 38, 25, 25, 29, 31, 33, 37, 38, 42, 43
What is the first quartile of the data?
25
27
29
33
The data shows the ages of teachers at a school.
33, 25, 42, 25, 31, 37, 43, 29, 38, 25, 25, 29, 31, 33, 37, 38, 42, 43
What is the third quartile of the data?
37
37.5
38
40
The data shows the ages of teachers at a school.
33, 25, 42, 25, 31, 37, 43, 29, 38, 25, 25, 29, 31, 33, 37, 38, 42, 43
What is the interquartile range of the data?
8
9
10
18
How many people spent money at the raffle?
200
140
80
60

How many more students own 4-6 pairs of shoes than own 10-12 pairs of shoes?
5
11
18
23
What does 69 represent in the box plot?
Lower Extreme
Lower Quartile
Upper Quartile
Upper Extreme
The data below represents the bowling scores of a group of friends. Determine the value that best represents each part of the box and whisker plot.
93, 129, 102, 115, 136, 85, 134, 108, 112, 125, 150, 144
Lower Extreme (a) Q1 (b) Median (c)
Q3 (d) Upper Extreme (e)

Which interval contains the median time?
26.0-27.9
28.0-29.9
30.0-31.9
32.0-33.9
34.0-35.9
What is the range?
The sum of the largest and smallest number
The number in the middle
The difference between the largest and smallest number
The number that appears most often

At Donald's Donuts the number of donut holes in a bag can vary. Help Donald find the MODE.
12,10,10,10,13,12,11,13,10
10
12
10 and 12
No Mode
The heights of some students are given.
158cm 172cm 164cm
164cm 167cm 159cm
What is the RANGE of the heights?
13 cm
330 cm
164 cm
14 cm
What is the MEDIAN of this set of data?
10, 90, 80, 60, 50, 40, 70, 30, 20, 100
50
60
55
45
The number of miles that Jenna cycled each week for a 7-week period is shown:
36, 42, 28, 52, 48, 36, 31
What is the median number of miles Jenna cycled?
24
39
36
52


Which of the following lists all parts of the five number summary?
Mean, Median, Mode, Range, and Total
Minimum, Quartile 1, Median (Q2) , Quartile 3, and Maximum
Smallest, Q1, Q2, Q3, and Q4
Minimum, Maximum, Range, Mean, and Median

What is the shape of the Data Set?
Skewed Left
Symmetrical
Skewed Right

Cars: skewed left
Cars: Skewed left
23, 34, 27, 7, 30, 26, 28, 31, 34
What is a group of data points that are close together called?
Gap
Outlier
Cluster
Peak
What is the term for a space between data points where no values are present?
Gap
Peak
Mode
Range
Which term describes a data point that is much higher or lower than the rest of the data?
Cluster
Outlier
Median
Interval
What is the highest point in a set of data, where one value occurs more frequently than others?
Peak
Mean
Range
Gap
What is the average of a data set, found by adding all numbers and dividing by the number of values?
Median
Mode
Mean
Range
What is the middle value in an ordered data set called?
Mean
Median
Mode
Range
What is the term for the number that appears most often in a data set?
Mean
Median
Mode
Range
What is the difference between the highest and lowest values in a data set?
Mean
Median
Mode
Range

Describe the clusters in this distribution.
There is a cluster from 2.2-2.6
There is no cluster because the data is all together.

Describe the gaps in the distribution.
There are no gaps in the data.
There is a gap at 15
There is a gap at 22

What is the maximum height in inches for all students surveyed?
(Your answer should only be a number)

What is the Outlier of this Data?
31
16
32
27

How many students have 12 Brothers and Sisters?
4 students
7 students
0 students
1 student

Identify the cluster of the data.
2 - 4
1 - 4
6 - 9
8 - 9
Identify the gap of the data.
1 to 5
3 to 5
6 to 9
1 to 10
Identify the outlier of the data.
9
6
8
2


What is the smallest dog's weight?
(Use the stem and leaf plot.)
1
40
13
0



32, 38, 40, 44, 44, 46, 49, 53, 55, 58, 62, 65, 68, 70, 72, 81
He put the data in a stem-and-leaf plot. What number did he leave out of the stem-and-leaf plot?


What is the Maximum data item on this stem and leaf plot?
56%
88%
94%
8122348%

What percent of the students have less than 40 songs in the play list?
6%
40%
35%
60%
What fraction represents the amount of the students have 45 or more songs in the play list?
103
31
152
51

The dot plot shows minutes it took students to finish their reading passage.
Which statement is supported by the data in the dot plot?
The most common number of minutes is 12 and 19.
The median number of minutes is 13.
60% of the students finished in less than 15 minutes.
Half the students took longer than 15 minutes.

A class conducted a survey to determine the number of pets in each student's household. They organized the information in a dot plot.
Which of the following statements is NOT supported by the data in the dot plot?
One-fourth of the students in the class have exactly two pets.
Fifty percent of the students in the class have more than one pet.
One-third of the students in the class have just one pet.
Twenty percent of the students in the class have more than two pets.

The table shows the results of a survey about favorite types of stores. Determine the relative frequency for each store.
clothing: 38%
electronics: 22%
pet: 10%
candy: 30%
clothing: 19%
electronics: 11%
pet: 5%
candy: 15%
clothing: 50%
electronics: 25%
pet: 5%
candy: 20%
clothing: 35%
electronics: 23%
pet: 15%
candy: 27%

Which sport represents the mode?
Soccer
Softball
Football
Basketball
When talking about percent's, my total percent is always going to be...?
50%
200%
100%
0%

How many boxes would you shade for 45%?
4 boxes
4 ½ boxes
3 boxes
3 ½ boxes

How many boxes would you shade for 30%?
1 box
1 ½ boxes
2 boxes
2 ½ boxes


How many total items were sold at the concession stand last night?
40
42
45
50

What is the percentage of candy sold last night?
30%
50%
60%
70%

What percent bar graph represent the data?


The table shows the number of each type of animal at a refuge. Determine the relative frequency for the cheetah.
(a)

What percent represents fruit?
(a)

What is the relative frequency of cheese pizza?
10%
3%
20%
33.3%

What is the relative frequency of High School?
2%
50%
5%
20%


A group of people were asked their favorite type of pet. Their responses are represented in the percentage bar graph shown. Which table best represents the data summarized in the percentage bar graph?


A group of 200 students were asked about their favorite superhero.
How many students selected Hulk as their favorite superhero?
5
75
10
105

Guests at a Walt Disney Resort were asked about their favorite Disney theme park. The results from 500 people surveyed are shown in the percent bar graph.
How many people said Hollywood Studios was their favorite theme park?
20
100
60
200
Guests at a Walt Disney Resort were asked about their favorite Disney theme park. The results from 500 people surveyed are shown in the percent bar graph.
What percent of people said Animal Kingdom was their favorite theme park?
90%
60%
150%
30%
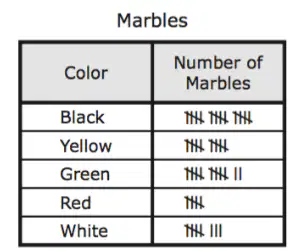
Shemar bought 50 marbles. He took the marbles out of the bag one at a time and recorded the color in this tally chart.
Match the percent of marbles to the color.
Black (a)
Yellow (b)
Green (c)
Red (d)
White (e)

What inference can be made about the populations based on Paisley's data?
young teachers drive trucks
SUVs are driven by teachers with families
most teachers drive sedans
fewer teachers drive sedans than SUVs
1) There are 400 students at Polly’s school. She surveyed a random sample of 80 students to find their favorite hobby
· 19 said they like to read
· 30 said they like to be with friends
· 8 said they like to do crafts
· 23 said they like to play sports.
Make an inference from the data.
Doing crafts is the least popular hobby at Polly’s school.
Reading is about ½ as much as students like to hang with friends.
Being with friends was the most popular hobby at Polly’s school.
About 25% of the students like to play sports.
About 80% of students prefer to read as a hobby.

Find the difference in the ranges in the double box plot.
7
8
2
1

Determine the difference in the interquartile ranges.
25
20
30
15

How much greater is the median for men than the median for women?
5
4
3
2

Robert took a survey of his friends car collection. Which frequency table represents Robert's data?


Which frequency table matches the dot plot?


Science: _________ Math: __________


Which car club has the higher median?
Cruisers
Car Hops
Neither, they are the same
What is data with variability?
Data or numbers that are different
Data or numbers that are all the same
Which pack would have variability?


Which bunch of apples has more variety?


Which group has less variability in clothing options?


Which weekly forecast has less variability?


Which situation would yield data WITH variability?
How many days are in a year?
How many days it rains each year?

