
 Worksheets
Ecology CSA corrections
Total questions: 19
Worksheet time: 10mins

Since the early 2000s, sea-star-wasting disease has affected the purple sea star population along the West Coast of the United States. In the 1960s, ecologists did an experiment, temporarily removing purple sea stars from a tide pool. During the experiment, the ecologists continually removed the sea stars from the tide pool for two years until their population was removed completely. Figure 1 shows the major organisms in the tide pool food web before the experiment, after one year, and after five years. What was the main organism present five years after the sea star removal?
Gooseck barnacle
Anemone
Mussel
Sea Snail

Since the early 2000s, sea-star-wasting disease has affected the purple sea star population along the West Coast of the United States. In the 1960s, ecologists did an experiment temporarily removing purple sea stars from a tide pool. During the experiment, the ecologists continually removed the sea stars from the tide pool for two years until their population was removed completely. Figure 1 shows the major organisms in the tide pool food web before the experiment, after one year, and after five years. Ecologists claim that sea-star-wasting disease will severely disrupt the coastal ecosystem. This claim is supported because:
A) Species richness increased during the experiment.
B) The coast is a much larger area than a tide pool with many more species.
C) The ecosystem remained stable after the sea stars were removed in the experiment.
D) The biodiversity remained low long after the sea stars were removed in the experiment.

(LS2.1) Scientists placed the bacteria P. fluorescens on a bean leaf and measured the total amount of sugar and bacteria population on the leaf. The leaf produces sugar continuously. Over time, the bacterial population changed. Figure 1 shows the amount of total sugar over time. Time is measured in hours (hr) and total sugar is measured in micrograms (μg) on one gram of leaf. Table 1 shows the population of bacteria over time. The population is measured in the number of viable cells on one gram of leaf. Viable bacterial cells are able to multiply. Calculate the slope (y2-y1/x2-x1) for the change in bacteria population overtime from 0 to 18 hours. Enter the numbers in the blank boxes. Round your answer to the nearest hundredths (0.00). 0-18 hours: __________ x 10⁷ cells/hr
0.02
0.05
0.08
0.10
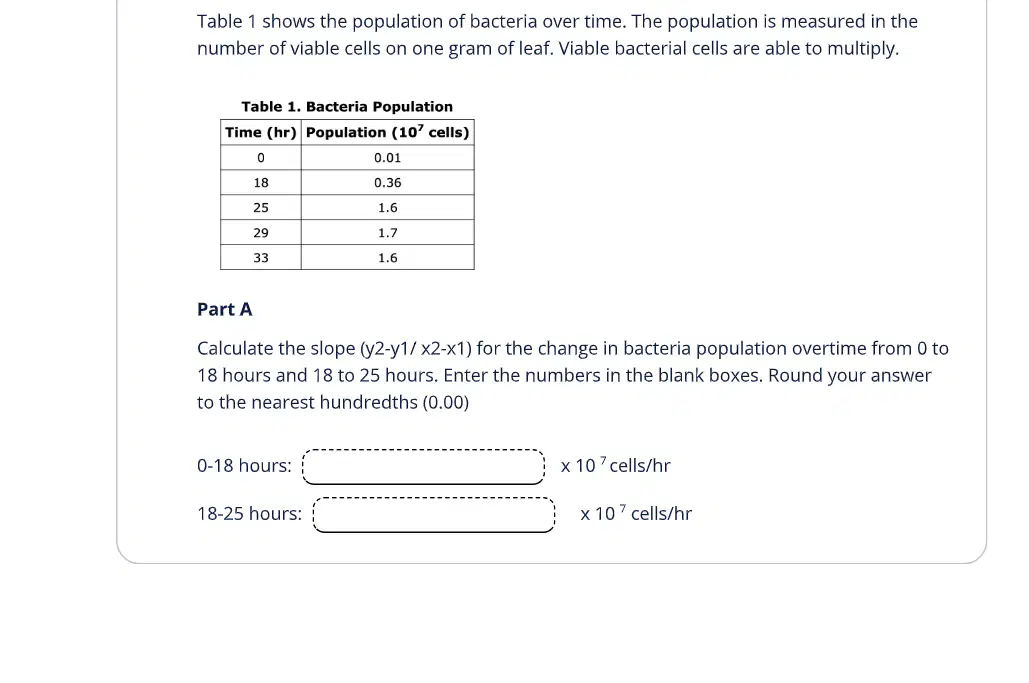
Calculate the slope (y2-y1/x2-x1) for the change in bacteria population overtime from 18 to 25 hours. Enter the numbers in the blank boxes. Round your answer to the nearest hundredths (0.00). 18-25 hours: __________ x 10⁷ cells/hr
0.02
1.2
-0.18

The number of bandicoots found on the Western Peninsula of Australia is different from the number of bandicoots found on Dorre Island, off the coast of Australia. Bandicoots are small mammals that are native to Australia. What is the best explanation for why the population is smaller on the Western Peninsula?
The predators on the western peninsula keeps population numbers down compared to Dorre Island
Dorre Island has less bandicoots due to a smaller area and absence of predators.
Both regions have the same number of bandicoots.
The Western Peninsula has fewer bandicoots due to a smaller area and absence of predators.
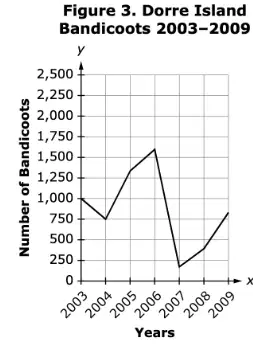
What is the population trend of the Dorre Island bandicoots after 2007?
The population on Dorre Island increased.
The population on Dorre Island continued to decline.
The population on the Western Peninsula began to recover.
The population on the Western Peninsula continued to decline.
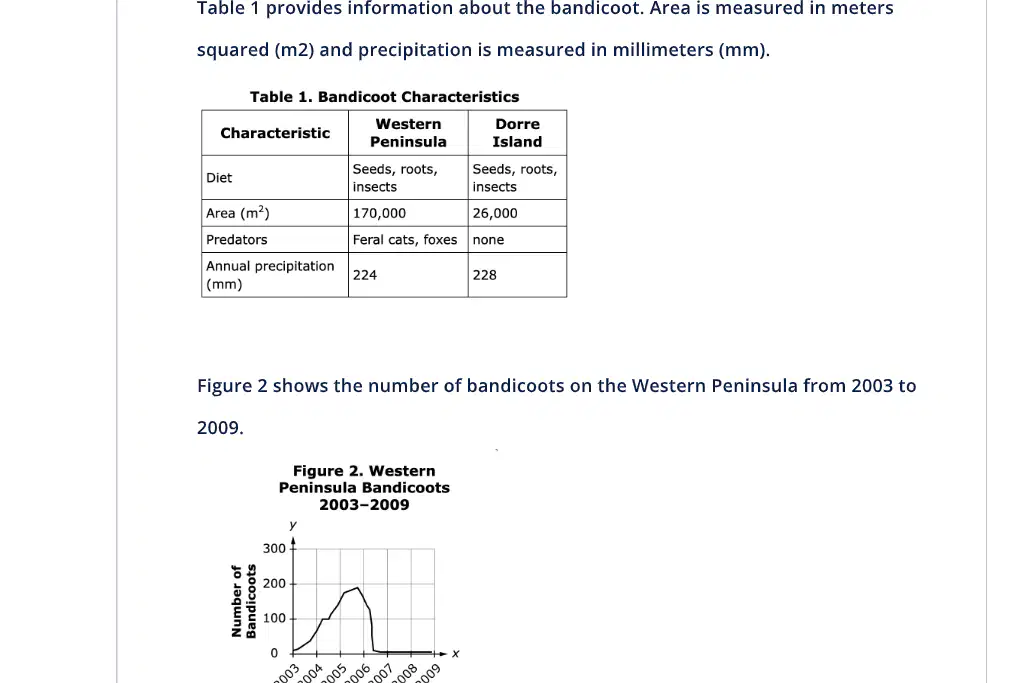
What is the main difference in the limiting factors that affect the bandicoot population on the Western Peninsula and Dorre Island?
The Western Peninsula has more predators.
Dorre Island has a larger area.
The Western Peninsula has a higher annual precipitation.
Dorre Island has more predators

In the early 1930s, beetles were destroying sugar cane fields in Australia. In 1935, farmers introduced cane toads from Puerto Rico to control the beetles. They bred over 100 toads in captivity before releasing them into the wild. Table 1 gives information about the number of cane toads in 1935. Using the data presented, which statement about the cane toad population in Australia is true?
The cane toad population exhibits logistic growth and has reached its carrying capacity.
The cane toad population exhibits linear growth and will never reach its carrying capacity.
The cane toad population exhibits is in the linear phase of logistic growth before approaching it carrying capacity.
The cane toad population exhibits exponential growth and the population may exceed its carrying capacity.
(LS2.4) After a sharp decline in the wolf population on an island in Lake Superior, the biomass of forage changed. The total area of the island is 534 square kilometers (km2). The Average mass of a moose is 367kg.
Determine the mass of the moose population on the island in 1980. Moose Density 1980: 1.4
Mass Equation= (Moose Density x Moose Average Mass x total area of the island)
274369
300000
230444
345677
Estimate the mass of forage (producers) needed to support the moose population in 1997 if the Moose total mass was 862303 . (Hint: Remember the 10% rule.)
8623030
86230.3
9000000
720000
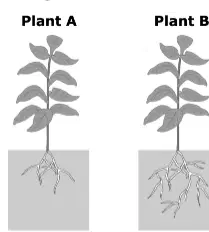
Two plants released the same amount of carbon into the atmosphere when they died, but Plant A and Plant B had different amounts of biomass in the geosphere. The two plants had the same rate of photosynthesis and cellular respiration. The plants had been growing for the same amount of time. Suberin is a natural compound found in the cell walls of all plant roots. Suberin does not easily degrade in the soil and can store carbon molecules for a very long period of time. Figure 1 shows both plants. Part A Which statement compares the structures of Plant A and Plant B?
(a) Plant A has less biomass than Plant B, which causes Plant A to decompose at a slower rate.
(b) Plant B has less suberin than Plant A, which prevents Plant B from degrading over time.
(c) Plant A has more suberin in its leaves than Plant B, which decreases Plant A's biomass.
(d) Plant B has more root mass than Plant A, which allows Plant B to hold more suberin.
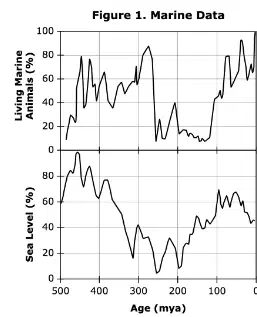
Which explanation of the relationship between number of living marine animals and sea level over time is consistent with the evidence given in Figure 1?
The number of living marine animals decreased after decreasing sea level led to smaller area of ocean on Earth.
The number of living marine animals increases after decreasing sea level led to greater availability of ocean nutrients.
Sea level increased as a result of more available fresh water because of an increase in the number of living marine animals.
Sea level decreased at the same time that the number of living marine animals decreased because of immediate feedback mechanisms.
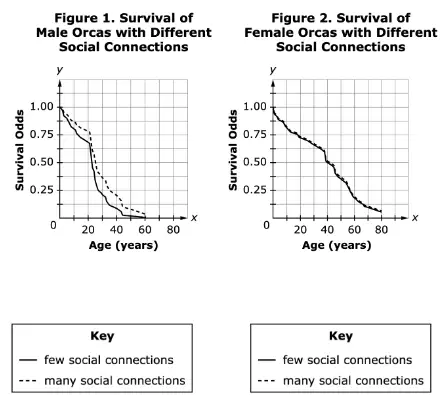
On average the male orcas live ____________ years less than females, regardless of social connections
20
50
40
30
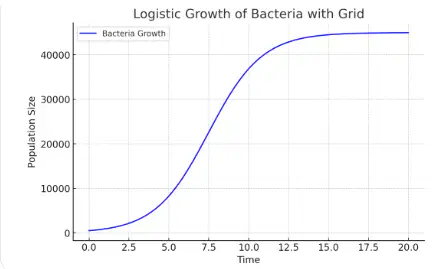
Determine the carrying capacity for the following bacteria population:
40,000
44,000
10,000
23,000
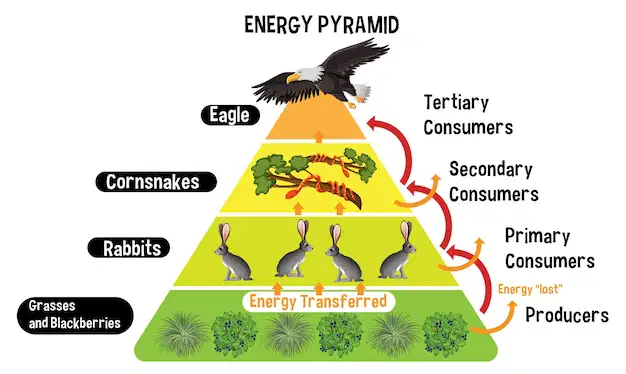
As you go up an energy pyramid, the amount of available energy __________________
decreases
increases
doubles
stays the same
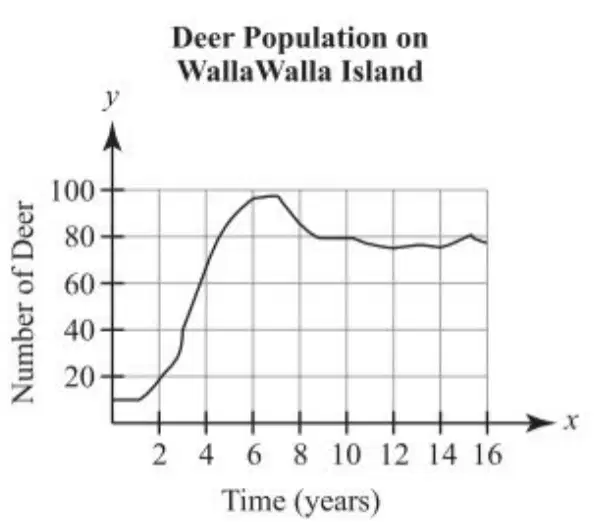
Which of the following best explains the population trend of the deer from year 2-6?
increased predation led to decline in population
limited predation of deer led to a population increase
can not determine
a new species of deer was introduced that competed with the original population
Which of the following best explains the population trend of the deer from year 8-16?
increased predation led to decline in population
limited predation of deer led to a population increase
population reached carrying capacity of WallaWalla Island
a new species of deer was introduced that competed with the original population
In a forest ecosystem, which of the following is the best example of a limiting factor for a rabbit (herbivore) population?
sunlight
squirrels
grass
frogs
In an ecosystem, energy flows from one trophic level to another, but nutrients must be continuously cycled to sustain life. Which statement best explains the role of decomposers in maintaining the stability of food webs and energy pyramids?
They transfer energy directly from the sun to consumers, reducing the need for primary producers.
They prevent energy from being lost as heat, ensuring that all energy remains available for higher trophic levels.
They break down organic material, releasing nutrients that support primary producers and sustaining the base of the energy pyramid.
They store excess energy in ecosystems by accumulating nutrients, reducing the need for nutrient cycling.

