
 Worksheets
EOM 6 Review
Total questions: 64
Worksheet time: 2hrs 8mins
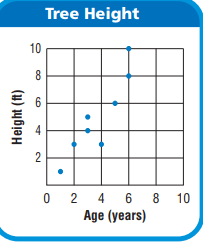
How many trees are 3 years old?
1
2
0
3

How many trees are more than 6 feet tall?
5
1
2
4

Mrs. Collins made a scatterplot to show the relationship between the number of absences and a student’s final exam score. Based on this scatterplot, a student with 12 absences should get approximately what score on the final exam?
60
92
70
76
Dennis kept track of the high temperature for 2 weeks in October. Here are the temperatures he recorded:
82, 81, 81, 86, 77, 82, 86, 82, 75, 73, 73, 64, 59, 55
Which stem and leaf plot correctly shows this data?


Select the data table that correctly matches the line plot.


The weights of boxes packed for shipping are shown in the stem-and-leaf plot below.
How many boxes weigh more than 45 pounds?
8
3
1
7

What was the dog with the biggest weight?
(Use the stem and leaf plot.)
89
90
17
1
How many dogs weigh 82 lbs?
(Use the stem and leaf plot.)
0
2
82
1
How many dogs weighed more than 80 pounds?
(Use the stem and leaf plot.)
2
1
0
5
What is the smallest dog's weight?
(Use the stem and leaf plot.)
1
40
13
0






Which table of values matches the math rule shown below
A
B
C
D
Trevor and Laura are playing a game called “Guess the Rule.” Laura says a number and Trevor names a new number that is created using the rule he made. Trevor’s rule is to add 23 to Laura’s number. Which table shows the pattern using Trevor’s rule?


The ordered pairs for the points on the coordinate plane satisfy the equation y = 5x.
Which table shows other points that satisfy the equation y = 5x?


John walks laps around a track. The table shows the time it takes John to walk different numbers of laps around the track.
Which statement about the numerical pattern in the table is true?
The table shows an additive pattern because the pattern in the table follows the rule y = x + 13.
The table shows a multiplicative pattern because the pattern in the table follows the rule x = 7.5y.
The table shows an additive pattern because the pattern in the table follows the rule x = y + 13.
The table shows a multiplicative pattern because the pattern in the table follows the rule y = 7.5x.

Kelly sold T-shirts to earn extra money. The graph shows the number of T-shirts she sold and the amount of money she earned.
Which statement about the pattern shown in the graph is true?
The graph represents an additive pattern because it shows x = y + 3.
The graph represents an additive pattern because it shows y = x + 3.
The graph represents a multiplicative pattern because it shows y = 3x.
The graph represents a multiplicative pattern because it shows x = 3y.

The x coordinate is vertical (up and down) or horizontal (across)?
Vertical (up and down)
Horizontal (across)

The Y coordinate goes vertically (up and down) or horizontally (across)?
Vertically (up and down)
Horizontally (across)

What is the correct order of coordinates?
(y,x)
(x,y)

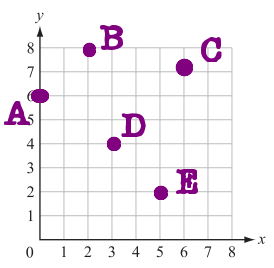
Which of the labels represents (5,1)?
B
A
C

Which of the labels represents (12,5)?
C
B
A

Which label represents (1, 12)?
A
B
C

Which coordinate represents A?
(1,1)
(3,1)
(7,0)

Which coordinate represents B?
(15,1)
(7,4)
(4,7)

Which coordinate represents C?
(9,4)
(7,7)
(0,1)

What coordinate represents D?
(7,4)
(1,1)
(15,18)


What is the missing number?


Is this table graphed correctly?
yes
no

Is this table graphed correctly?
yes
no
y = 7.5x
Additive
Multiplicative
y = x + 2
Additive
Multiplicative
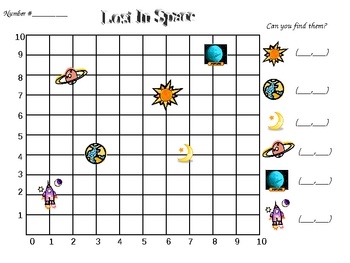
Explain how to graph (3, 4) on thee coordinate plane
Start at the origin move up 3 places and down 4 places
Start at 3 on the y-axis and go down 4 units
Start at the origin, move 3 places to the right and 4 places up
Start at the origin, move 4 places right and 3 places up
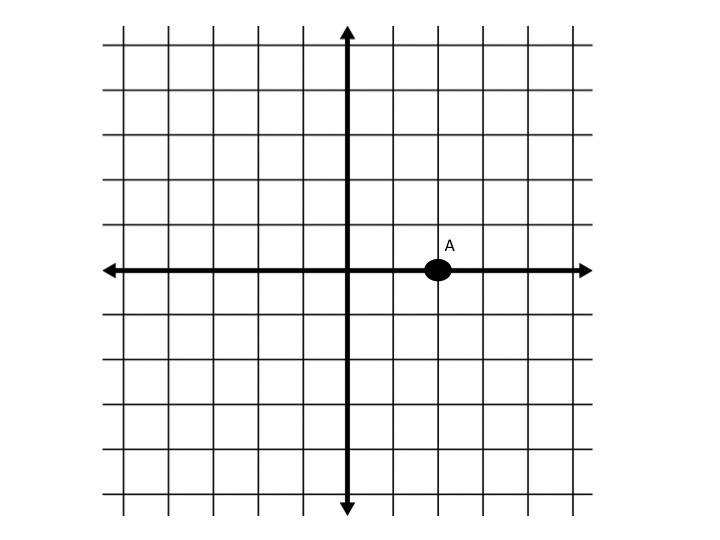
What is the ordered pair for point A?
( 2, 0)
( 0 , 2)
(0, -2)
(-2,0)


