
NEW
Font size
 Worksheets
Line Graph Quiz
Total questions: 14
Worksheet time: 16mins

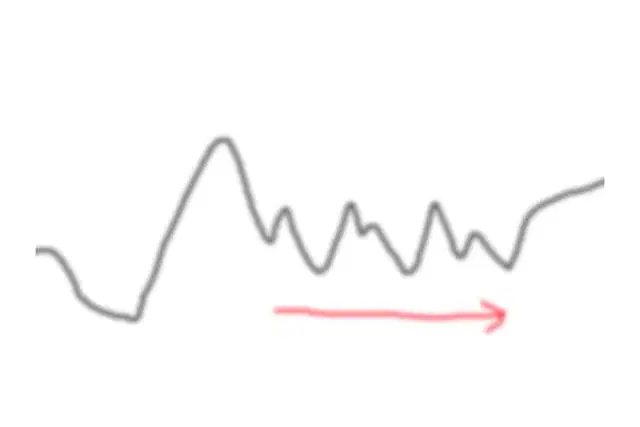
Choose the best phrase to describe the trend
fell gradually
dropped to a peak
fluctuated
fell sharply
Choose the best phrase to describe the trend
remained unchanged
fluctuated
jumped around
changed significantly

Choose the best phrase to describe the trend
remained stable
reached a trough
reached a midpoint
stayed the same
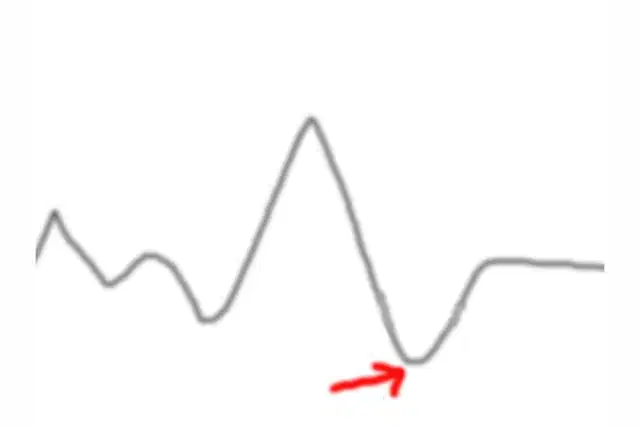
Choose the best phrase to describe the trend
hit a low of
hit the bottom
troughed out
hit a peak of

Choose the best phrase to describe the trend
increased dramatically
rose significantly
stood at
rose gradually
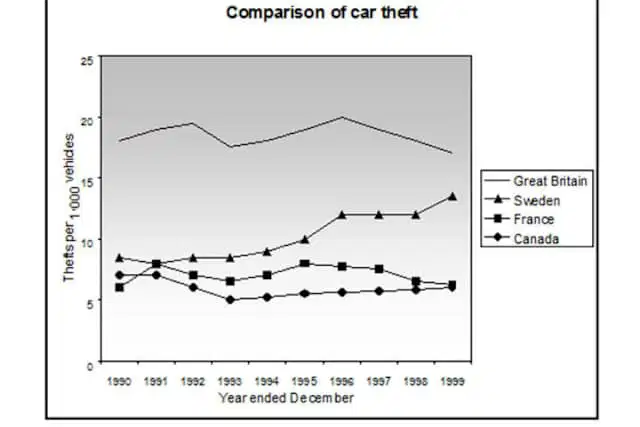
If you describe the above graph, should you write about every change you see?
YES
NO
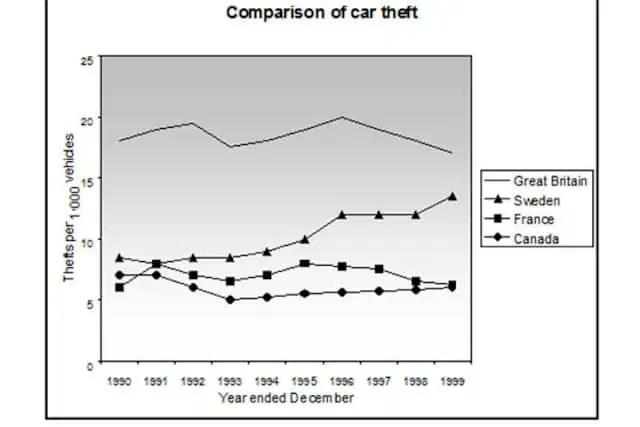
Should you make sure you write about every country?
YES
NO
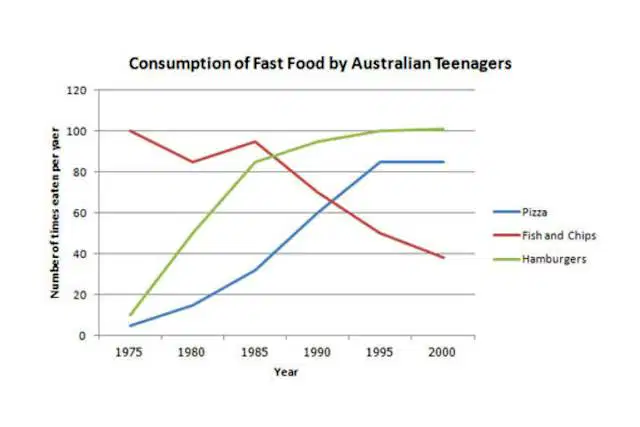
Is this description of the graph ok?
"From 1975 to 1995, hamburgers increased from 10 to 100".
YES
NO

This is the rubric for the graph you just looked at. Which is the best introduction for the graph?
The line graph shows changes in the amount and type of fast food consumed by Australian teenagers from 1975 to 2000
The line graph cpmpares the quantity and kinds of fast food eaten by teenagers in Australia between 1975 and 2000
The line grph illustrates changes in the fast food eaten by teenagers in Australian teenagers from 1975 to 2000
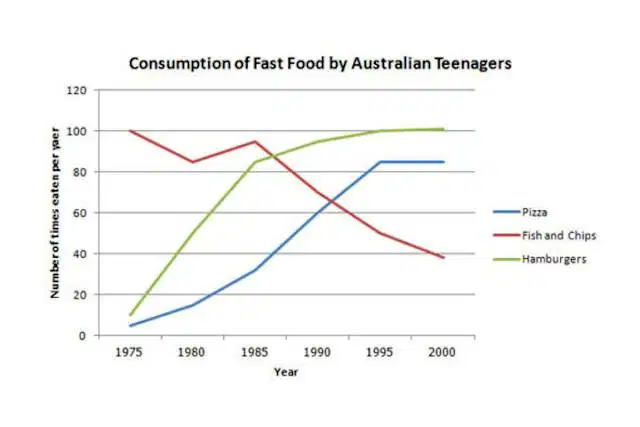
It’s good to group items that are doing similar things together on the graph. You can then put them together in paragraphs. What could you group together in this graph so that you have two body paragraphs?
Pizza with fish and chips, and hamburgers separately
Pizza with hamburgers, and fish and chips separately
Fish and chips with hamburgers, and pizza separately
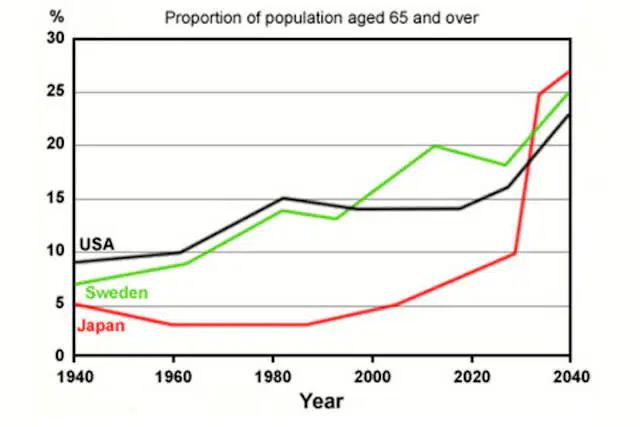
How would you group this one?
Japan with Sweden, and USA separately
USA with Japan, and Sweden separately
USA with Sweden, and Japan separately

How many body paragraphs should a line graph have?
No fixed number
3
2
4
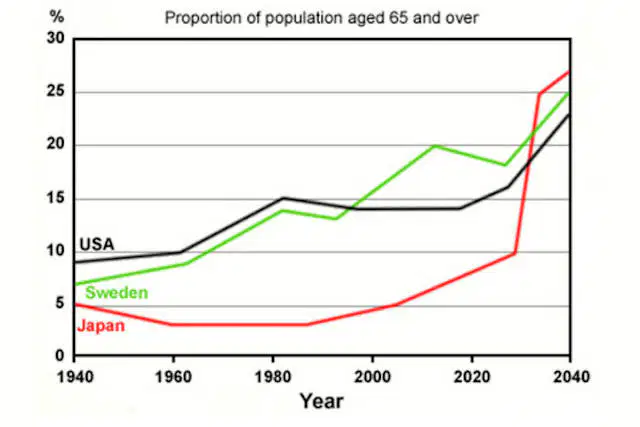
Any Academic Task 1 should have an overview, which identifies the general overall trends occurring. Which is the best one for the graph?
Overall, Japan ended the period with the most people aged over 65, at 27%
Overall, the proportion of people over the age of 65 increased in every country over the time period shown.
Overall, the proportion of people over the age of 65 in Sweden fluctuated over the period

Does an Academic Task 1 such as a line graph need a conclusion?
YES
NO

