
 Worksheets
Univariate
Total questions: 24
Worksheet time: 6hrs 0mins

Which battery has the greater median?
Rejuvenate has a greater median by about 10 days.
Rejuvenate has a greater median by about 20 days.
New Life has a greater median by about 10 days.
New Life has a greater median by about 20 days.
Hank and Colt track the number of basketball points scored per game. The data sets show the number of points each has scored in the last five games.
Hank: 26, 26, 26, 28, 30
Colt: 24, 24, 24, 26, 40
Which statement BEST explains why Colt’s mean score is greater than Hank’s?
The range of scores for Colt is greater than the range of scores for Hank.
The median of Hank’s scores is greater than the median of Colt’s scores.
The mode of Hank’s scores is greater than the mode of Colt’s scores.
The data for Colt has an outlier that the data for Hank does not have.
Sara collected the femur length, in inches, of her classmates. She used these values to create a dot plot. Sara multiplied each value by 3 and created a second dot plot. Which characteristic of the two dot plots must be the same for both data sets?
The range of the data.
The mean of the data.
The interquartile range of the data.
The number of data points plotted.

Is it possible to find the mode from a box and whisker plot?
Yes, because the plot shows the frequency of each score.
No, because the plot only shows the minimum, quartiles, median, and maximum values, not the frequency of individual data points.
Yes, because the mode is always the median in a box and whisker plot.
No, because the plot only shows the mean and range.

Is it possible to find the median from a box and whisker plot? If so, what is the median value shown in the plot?
No, it is not possible to find the median from a box and whisker plot.
Yes, it is possible, and the median is 82.
Yes, it is possible, and the median is 75.
Yes, it is possible, and the median is 90.
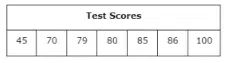
Which measure of central tendency should be used to BEST describe the test data?
The mean because the data contains an outlier.
The median because the data contains an outlier.
The mean because the data does not contain an outlier.
The median because the data does not contain an outlier.
Which data plot clearly identifies an outlier and its value?


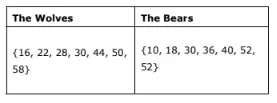
The table contains scores for two different basketball teams.
Which is TRUE about these two data sets?
The modes are equal.
The ranges are equal.
The Bears have a greater mean.
The Wolves have a greater median.
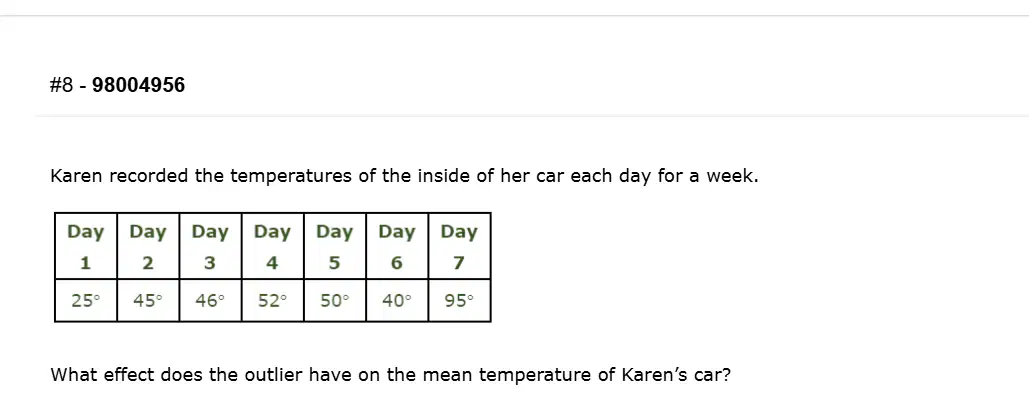
What effect does the outlier have on the mean temperature of Karen’s car?
Since the outlier is a low value, its removal would raise the mean.
Since the outlier is a low value, its removal would lower the mean.
Since the outlier is a high value, its removal would raise the mean.
Since the outlier is a high value, its removal would lower the mean.
Which histogram is skewed to the right?


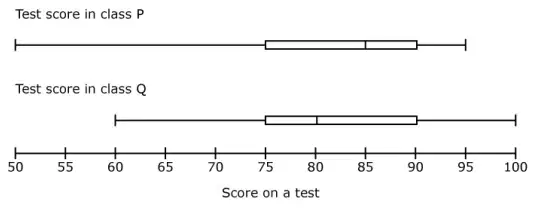
Two groups of students in two different classes, class P and class Q, took a test. The results were collected and graphed in a box plot. Which statement is TRUE?
Class P had a greater interquartile range than Class Q.
The student with the lowest score was in Class Q.
The range was the same in both classes.
Class P had a higher median than Class Q.
The information below shows the margin of victory for two teams with 21 wins. Team A: 2, 3, 5, 6, 7, 8, 9, 11, 12, 13, 13, 14, 15, 16, 17, 18, 19, 20, 22, 23, 25 • Mean: 13.24 • Median: 13 • Range: 23 • Mean absolute deviation: 5.39 • Interquartile range: 11 Team B: 1, 2, 3, 3, 4, 5, 6, 7, 7, 8, 8, 9, 9, 10, 11, 12, 13, 14, 16, 17, 21 • Mean: 8.86 • Median: 8 • Range: 20 • Mean absolute deviation: 4.14 • Interquartile range: 8 Which TWO statements are TRUE related to the key characteristics?
Both teams performed similarly in the 21 wins based on the mean score.
Both teams performed similarly in the 21 wins based on the median score.
Team B had a closer margin of victory based on the mean absolute deviation.
Team B had a greater spread in the margin of victory based on a lower range.
Team A had a greater spread in the margin of victory based on a greater interquartile range.
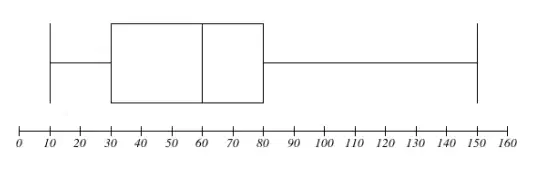
What is the shape of the data?
uniform
symmetric
skewed left
skewed right
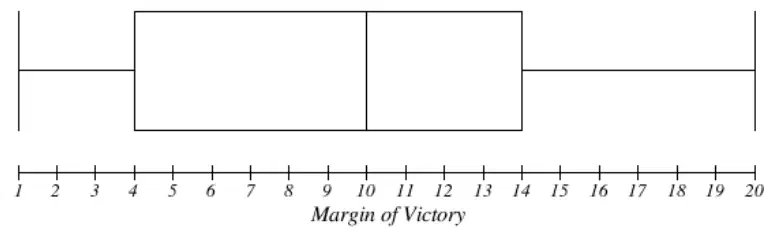
A basketball team has these margins of victory in the first 14 games: 1, 4, 8, 15, 17, 20, 12, 13, 14, 3, 8, 3, 10, 12. The results are shown incorrectly on the box plot. What error was made in the box plot?
The error is the location of the box. The box is required to start at the minimum value of 1 and the maximum value of 20.
The median for the box plot is incorrect. The mean of the data set is 10 points, which is shown in the box plot. The median is 11 points for the set of data.
The error is the location of the whiskers. The whiskers are required to stop at the value before the minimum, which is 3, and the value before the maximum, which is 17.
The median for the box plot is incorrect. The mean of the data set is 10 points, which is shown in the box plot. The median is 12.5 points because this is the middle number in the list.
Which measure of center and spread is used to compare two sets of data that each contain an outlier that is skewing the graph?
mean and interquartile range
median and interquartile range
mean and mean absolute deviation
median and mean absolute deviation
A survey was given to two groups of students about the number of pets in their place of residence.
Group A: 0, 1, 1, 2, 2, 2, 3, 3, 3, 4, 4, 4, 5, 5, 6
Group B: 0, 0, 1, 1, 1, 2, 2, 2, 2, 2, 3, 3, 3, 4, 4
Which conclusion BEST represents the comparison between the two data sets?
The median is 1 greater for group A when comparing the two data sets. This description is a more accurate description because each set of data is uniform.
The median is 1 greater for group A when comparing the two data sets. This description is a more accurate description because each set of data is symmetrical.
The mean and median are 1 greater for group A when comparing the two data sets. This description is a more accurate description because each set of data is uniform.
The mean and median are 1 greater for group A when comparing the two data sets. This description is a more accurate description because each set of data is symmetrical.
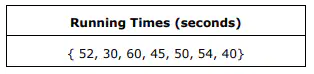
What is the interquartile range of Anne’s running times?
14 seconds
30 seconds
40 seconds
54 seconds
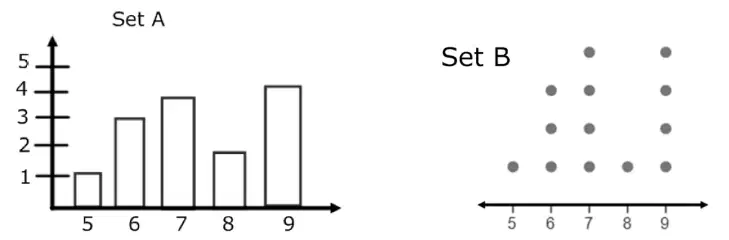
Refer to the graphs for Set A (bar graph) and Set B (dot plot). Which set of data has the greatest mean?
Set A
Set B
Set A and Set B have the same mean, 7
Set A and Set B have the same mean, 9
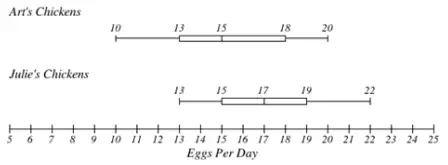
Two farmers, Art and Julie, each have 20 egg-laying chickens. The number of eggs each farmer received from their chickens every day for six months is shown in the box plots below. Art's Chickens: [Box plot with values 10, 13, 15, 18, 20] Julie's Chickens: [Box plot with values 13, 15, 17, 19, 22] Which statement is TRUE based on the information shown?
On average Julie gets two more eggs per day than Art.
Julie has only one chicken that produces 22 eggs per day.
They both have 5 chickens that produce between 13 and 15 eggs per day.
Art has more chickens producing between 15 and 18 eggs than between 13 and 15 eggs.
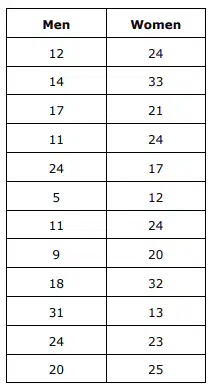
The table gives the number of men and women enrolled in a pottery class. Which conclusion can be made about the data?
The range and IQR for men are greater than the range and IQR for women, which indicates that the data is more spread out for women.
The range and IQR for men are greater than the range and IQR for women, which indicates that the data is more spread out for men.
The range and IQR for men are less than the range and IQR for women, which indicates that the data is more spread out for women.
The range and IQR for men are less than the range and IQR for women, which indicates that the data is more spread out for men.
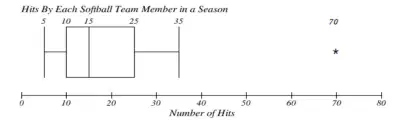
Jaden plays on a softball team with 12 other players. The box plot shows the number of hits by each player on her team last season. The mean value is 22. Which reason could explain why the mean is different than the median?
The majority of players had greater than 15 hits.
One player had a significant impact on the mean.
The interquartile range (IQR) is less than the mean.
More players hit between 15 and 25 hits than between 10 and 15 hits.

Refer to the plots for Set A (dot plot) and Set B (box plot) shown above. Which statement about the data sets is TRUE?
Set A and Set B have the same mean.
Set A and Set B have the same mode.
Set A and Set B have the same median.
Set A and Set B have the same interquartile range.
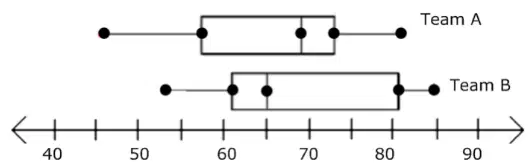
Which team has the greatest median for points scored per basketball game?
Team A has the greatest median.
Team B has the greatest median.
Team A and Team B have the same median.
The medians for Team A and Team B cannot be determined.
The list shows the points scored by a basketball player in the first 8 games of the season.
2, 8, 18, 18, 18, 18, 19, 19
Which statement is TRUE?
Including the 2-point outlier in the data causes the mean to decrease from what it would have been if the outlier were not included.
Including the 2-point and 8-point outliers in the data causes the mean to decrease from what it would have been if the outliers were not included.
Including the 2-point outlier in the data causes the mean and the median to decrease from what they would have been if the outlier were not included.
Including the 2-point and 8-point outliers in the data causes the mean and the median to decrease from what they would have been if the outliers were not included.

