
 Worksheets
Grade 5 End of Module 5
Total questions: 62
Worksheet time: 3hrs 32mins

The graph shows after-school activities students report doing most often. How many students spend time in an after school activity other than homework?
18
86
104
71

Use the tally to count the number of: Dog
(a)
Use the tally to count the number of: Elephant
(a)

The pictogram shows the number of hours of sunshine in one day.
How many hours of sunshine did Swansea have?
2 hours
2.25 hours
8
9

What type of graph is this?
bar graph
picture graph
tally chart
line graph


Which topping has got 250 votes?
pepper
tomato
mushroom

How many more pies were sold on Tuesday than Wednesday?
3
40
60

If three more students voted for bananas, how many votes would have?
10
5
2

Which day of the week had the lowest temperature?
Monday
Thursday
Tuesday
Wednesday




How many students scored between a 86 and a 100?
10
7
11
4
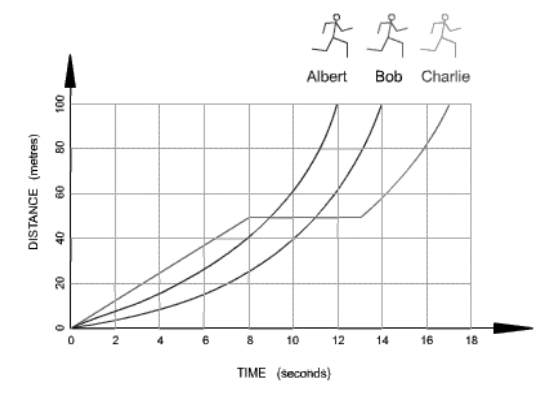
Which runner stopped for a rest?
Albert
Bob
Charlie
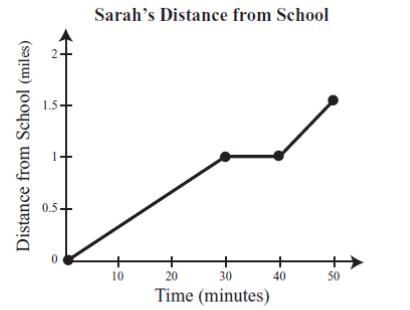
What is happening in the graph between 30 and 40 minutes?
Sarah is accelerating
Sarah is not moving
Sarah is slowing down
Sarah is travelling at a constant speed

A restaurant recorded the number of pizzas sold each month for one year. The data are shown in the graph below. During which month did the restaurant sell 40 pizzas?
March
May
July
August

What is happening at D?
Stationary
Accelerating
Fast steady speed; moving away from the starting position
Slower steady speed; moving away from the starting position

What is happening at E?
Stationary
Accelerating
Fast steady speed; moving away from the starting position
Steady speed; returning to start position

What label is along the y-axis in this graph?
Copyright 2007
Lines
Age in Years
Number of Teens

How much does it cost to have your lawn mowed for 2 hours?
$16
$17
$18
$19
Every graph must have a
Pet
Candy bar
Title
Chromebook


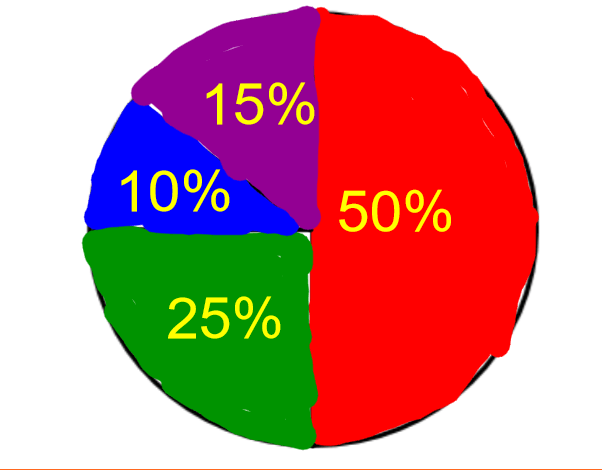
What percentage does the entire circle graph represent?
100%
50%
25%
15%



Between which two days did the amount of minutes spent doing homework stay the same?
Monday to Tuesday
Tuesday to Wednesday
Wednesday to Thursday
Thursday to Friday

Based on the data in the table, how many students played the three games that had the highest frequency?
62
57
60
61

The number of teachers at four schools are shown in the bar graph below. The number of teachers at school S is missing. There are a total of 56 teachers at schools S, T and V. Which bar graph represents the number of teachers at school S?


How many people voted for Monterrey Jack and Swiss?
11
16
22
Not Here
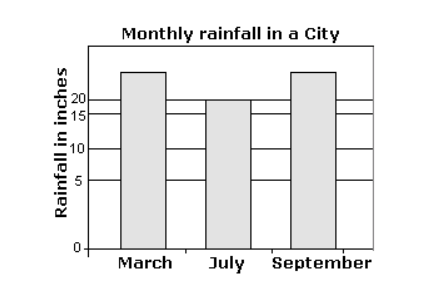
What is the error in this graph?
Title for the bar graph
width of a bar
key is not appropriate
scale is not even


The bicyclist stopped and rest in ____ different intervals?
2
3
4
5
6

A
B
C
D

What type of graph is it?
Bar Graph
Line Graph
Double Bar Graph

What is the difference on sales of blenders between Store A and Store B?
30
10
40
From 11 A.M. to 12 P.M. did the number of fish caught increase or decrease?
Increase
Decrease
What is the total number of fish caught?
39
38
37

What percent of morning sales were of tea or donuts?
21%
47%
43%
41%
All circle graphs have...
a key and a map
a title and a key
a title and a scale
a key and a compass

Alex and Joe used a double-bar graph to record the number of points they scored in their first two basketball games. What is the total number of points that both boys scored in both games?
20
22
26
44
When you calculate speed you should .......the distance by the time.
multiple
subtract
add
divide

What is the correct view of F


What is the correct view of E


Which diagram below shows the right view of this object?


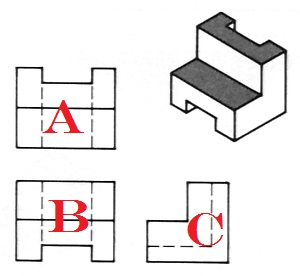
What view would go in position B of a multiview sketch?
Top
Front
Right side


Which drawing below shows the Top View?



