
 Worksheets
Intro to Correlation Coefficient
Total questions: 23
Worksheet time: 1hrs 7mins
A study compared the number of years of education and a person's annual salary. The correlation coefficient of the data was r = 0.913. Which conclusion can be made using the correlation coefficient?
There is a strong positive correlation.
There is a strong negative correlation.
There is no correlation.
There is a weak positive correlation.

The relationship ship between a woman's show size and length of her foot, in inches, is given in the table.
Calculate the line of best fit using the graphing calculator.
a = .25 and b = 7.75
y = .25x + 7.75
r = 1
y = ax + b

As shown in the table, a person's target heart rate during exercise changes as the person gets older. Use the graphing calculator to find the correlation coefficient (r).
-0.999
-0.664
0.998
1.503

What COULD be the approximate value of the correlation coefficient for the scatter plot?
-.851
-.162
0.211
0.905

The points in the scatter plot show the ages of cars (x) and their price in dollars (y). What could you conclude about the relationship of the data?
Age and price have no correlation.
Age and price have a weak positive relationship.
Age and price have a weak negative relationship.
Which value of r represents data with a strong positive correlation between two data sets?
0.89
0.34
1.04
0.01
The relationship between x, a student's test scores and y, the student's success in school. Based on this information, what could the relationship between the data?
As the test scores increase, the student's success increases.
As the test scores increase, the student's success decreases.
There is no relationship between test scores and student success.
Which calculator output shows the strongest relationship between x and y?


Which graph represents data that has a correlation coefficient close to -1?
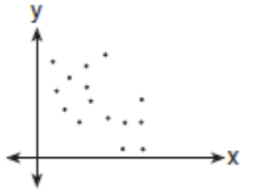
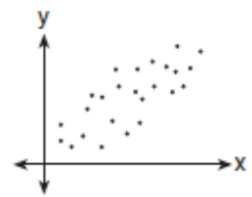
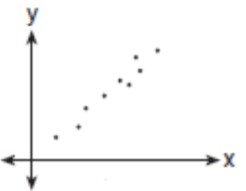
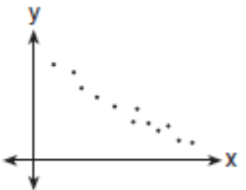
Which scatter plot diagram shows the strongest positive correlation?
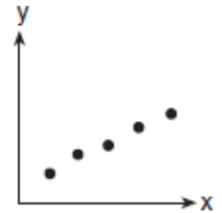
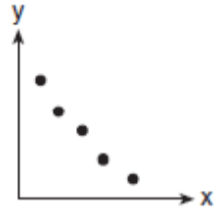
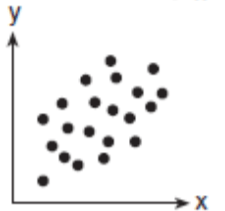
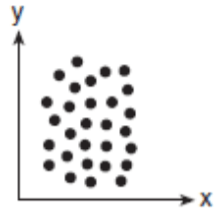

Using the graphing calculator to determine the correlation coefficient for each data set. Which one has a bigger correlation coefficient?
Set A
Set B
They are equal.

Using your graphing calculator determine the line of best fit and the correlation coefficient of the data in the table.
y = 4.6x - 347
r = .942
y = 4.6x - 347
r = .888
y = 4.6x + 347
r = .942
y = 4.6x + 347
r = .888

Estimate the correlation coefficient
r = 1
r = -1
r ≈ -0.8
r ≈ 0.8
r ≈ -0.5
Which scatter plot diagram shows the strongest positive correlation?
Write an equation to represent the below situation “A library has 8000 books, and is adding 500 more books each year.”
y=8000-500x
y=8000*50x
y=500x+8000
y=8000(1.5)x
"Julie gets a pre-paid cell phone. Initially she has a $40.00 balance on the phone. Each minute of talking costs $0.15."
Linear or exponential?
y=40x+.15
y=40-.15x
y=40(1.015)x
y=40+.15x
y=40(.15)x


The number of newly reported crime cases in a county in New York State is shown in the accompanying table, where x represents the number of years since 1994, and y represents number of new cases. Write the linear regression equation that represents this set of data, rounding all coefficients to the nearest hundredth. Using this equation, find the projected number of new cases for 2003, rounded to the nearest whole number.
974
25,101
940
952





