
 Worksheets
Statistics and Probability Formative Assessment Grade 6
Total questions: 10
Worksheet time: 15mins
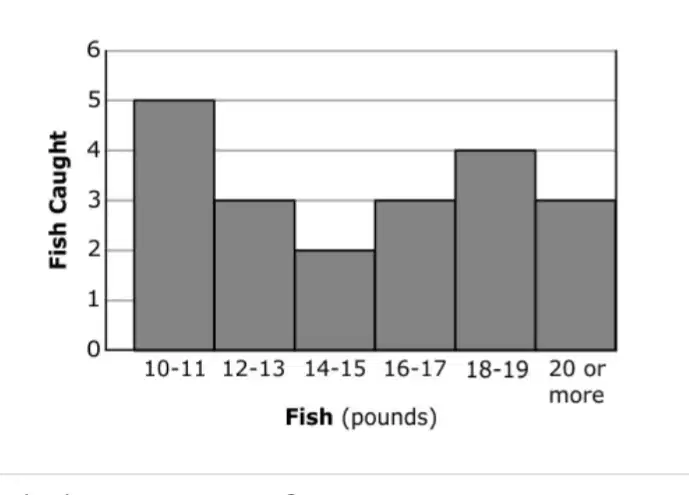
The captain of a fishing team recorded the weight (rounded to the nearest pound) of each fish that the team caught. Then he made a histogram to display the recorded weight information. Which choice is a true statement?
Half of the fish had recorded weights of at least 16 pounds.
More than half of the fish had recorded weights between 10 and 11 pounds.
There was an 8-pound range in the recorded weights of the fish.
The average recorded weight of all the fish was less than 14 pounds.
A basketball team scored the following numbers of points in its first 6 games: 98, 98, 102, 96, 98, and 97. How many points will the team need to score in the seventh game in order to bring its average number of points per game to 100?
100
101
102
111
Alma measured the heights (in inches) of 10 students in her class. The measurements she recorded are listed below.
57, 66, 58, 59, 64, 58, 63, 64, 60, 62
Which of the following is the correct box plot for Alma’s data?

Option A

Option B

Option C

Option D
Four students in Mrs. Jackson’s class plotted their eight math test scores on line plots. Which student had the lowest median score for the eight tests?

Albert’s Test Scores

Becky’s Test Scores

Carlos’s Test Scores

Dorothea’s Test Scores

This table shows the number of minutes Carol and Anna walked each day for 5 days. Which statement is true?
A. Carol’s mean for the number of minutes she walked is equal to her median.
B. Carol’s mean for the number of minutes she walked is greater than Anna’s mean.
C. Anna’s median for the number of minutes she walked is greater than her mean.
D. Anna’s mean for the number of minutes she walked is equal to Carol’s mean.
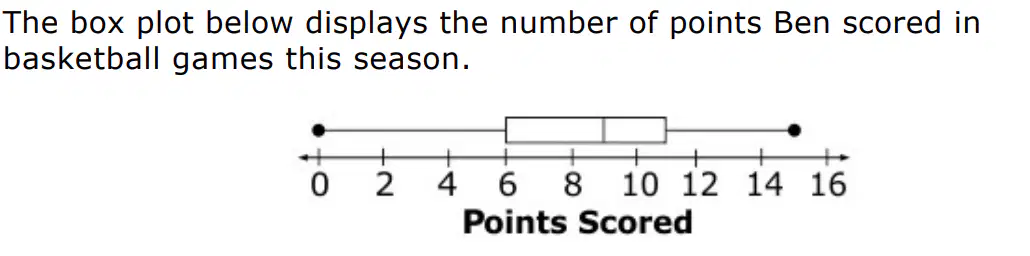
In 50% of the games, the number of points scored is greater than or equal to what score?
(a)
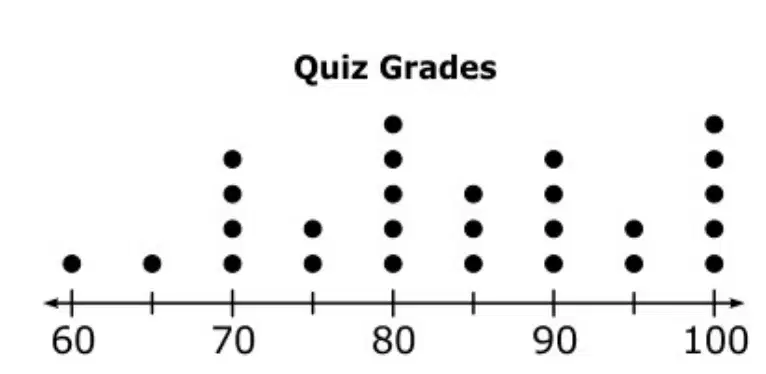
Mr. Roberts displayed the quiz grades for one of his classes on the dot plot below.
What is the median of the quiz grades?
90
85
80
75
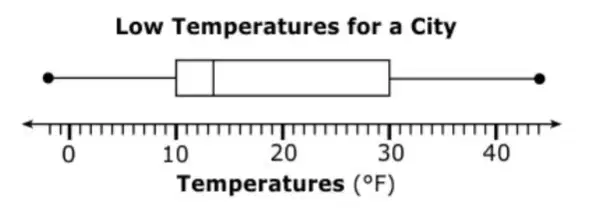
The data set used to construct the box plot below consisted of the daily low temperature readings for a city over a period of ten days. Which choice could be the data set that was used to construct the box plot?
{-2, 5, 10, 11, 12, 15, 21, 30, 32, 44}
{-2, 5, 9, 11, 12, 16, 21, 30, 32, 44}
{-2, 5, 10, 11, 12, 15, 21, 32, 32, 46}
{-2, 5, 10, 11, 12, 15, 21, 32, 32, 44}
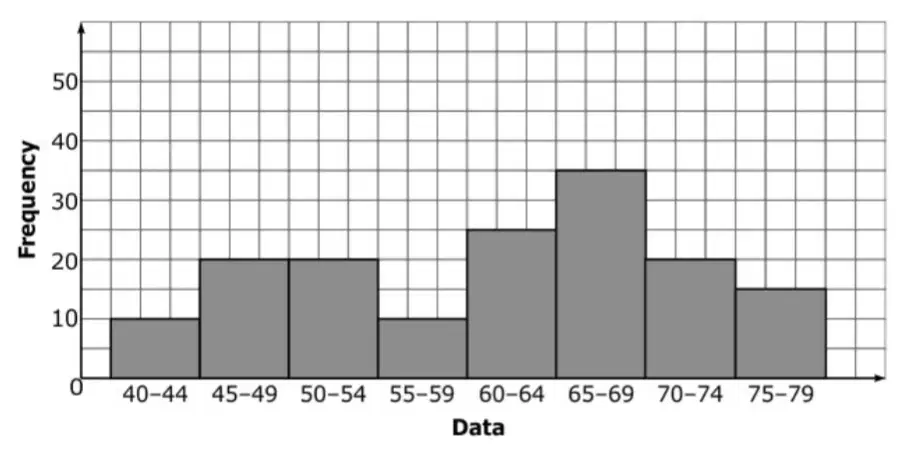
What column contains the median?
A. 55–59
B. 60–64
C. 65–69
D. 70–74

For how many days were the number of televisions sold greater than the median for the 7-day period?
A. 3
B. 4
C. 5
D. 7

