
 Worksheets
Descriptive vs Inferential Statistics Long Quiz
Total questions: 89
Worksheet time: 25mins
What is the primary purpose of descriptive statistics?
To make predictions about a population
To summarize and describe features of a dataset
To analyze relationships between variables
To test hypotheses about population parameters
Which of the following is NOT a measure of central tendency?
Median
Mode
Mean
Standard Deviation
What does inferential statistics allow researchers to do?
Summarize data from a sample
Calculate measures of dispersion
Make inferences about a larger population
Visualize data through graphs
Which statistical technique is commonly used in inferential statistics?
Histograms
Box plots
Hypothesis testing
Frequency distributions
What is the range in measures of dispersion?
The average of the dataset
The average squared differences from the mean
The difference between the maximum and minimum values
The most frequently occurring value
Which of the following is an example of a graphical representation in descriptive statistics?
t-test
Regression analysis
Box plot
Confidence interval
What is the goal of inferential statistics?
To summarize data visually
To calculate the mean and median
To provide insights into a dataset
To make predictions or draw conclusions about a population
Which of the following tools is commonly used for descriptive statistics?
SAS
All of the above
SPSS
R
What does a confidence interval provide?
A single value estimate of a population parameter
A range of values within which a population parameter likely lies
A graphical representation of data
A measure of central tendency
Which of the following is a common method in hypothesis testing?
ANOVA
Box plot
Histogram
Standard deviation
What is the median?
The difference between the highest and lowest values
The middle value when data is ordered
The average of all values
The most frequently occurring value
Which of the following is a characteristic of descriptive statistics?
It predicts future outcomes
It tests hypotheses
It summarizes and describes data
It generalizes findings to a larger population
What type of analysis does regression analysis involve?
Examining relationships between variables
Visualizing data through graphs
Summarizing data characteristics
Analyzing frequency distributions
Which of the following is a measure of dispersion?
Mean
Median
Variance
Mode
Which two are examples of descriptive statistics?
Median and correlation.
Mean and standard deviation.
Hypothesis testing and histograms.
Variance and regression analysis.
In statistics, a sample:
Can be used for inferences but not for predictions.
Is another word for population.
Is a set of data taken from the population to represent the population.
Is only used in descriptive statistics.
What is statistical estimation?
Methods for rounding answers in statistical calculations.
Methods to determine the best graph to represent statistical data.
Methods for reducing errors in inferential statistics.
Methods for reducing errors in descriptive statistics.
How do descriptive and inferential statistics differ?
Descriptive statistics are more computationally sophisticated than inferential statistics.
Inferential statistics are more computationally sophisticated than descriptive statistics
Descriptive statistics only attempt to describe data, while inferential statistics attempt to make predictions based on data.
Inferential statistics only attempt to describe data, while descriptive statistics attempt to make predictions based on data.
A prediction has been made that the chance that a person will be robbed in a certain city is 15%.
Inferential
Descriptive
Tell if the statement if Descriptive or Inferential
A recent survey of 2000 adults having an MBA reported that the average salary is more than $65,000 a year.
Inferential
Descriptive
Tell if the statement if Descriptive or Inferential
The chances of you getting a new car is about the same as passing your statistics class.
Descriptive
Inferential
Between a Population and Sample: which size is bigger ?
Population
Sample
Both can be the same
Not enough information
These are the two types of statistics:
Discrete and Continuous
Population and Sample
Descriptive and Inferential
Mean and Standard deviation
What is statistical estimation?
Methods for rounding answers in statistical calculations.
Methods to determine the best graph to represent statistical data.
Methods for reducing errors in inferential statistics.
Methods for reducing errors in descriptive statistics.
What are two examples of inferential statistics?
Range and percentiles.
Mean and probability distributions.
Regression analysis and hypothesis testing.
Variance and correlation.
A prediction has been made that the chance that a person will be robbed in a certain city is 15%.
Inferential
Descriptive
Tell if the statement if Descriptive or Inferential
The Senior Citizens that live in Pekanbaru have better memories than the ones that live in Padang.
Inferential
Descriptive
Between a Population and Sample: which size is bigger ?
Population
Sample
Both can be the same
Not enough information
The average age of the students in a statistics class is 22 years. Does this statement describe descriptive or inferential statistics?
Inferential statistics
Descriptive statistics
From past figures, it is predicted that 30% of the registered voters will vote in the March primary. Does this statement describe descriptive or inferential statistics?
Descriptive statistics
Inferential statistics
The process of using information from a sample to make generalizations about the larger population is called statistical inference.
True
False
Which of the following is not an element of descriptive statistical problems?
information revealed in a data set is summarized
predictions are made about a larger set of data
data are displayed visually in graphs
patterns in a data set are identified
An assembly line is operating satisfactorily if fewer than 4% of the phones produced per day are defective. To check the quality of a day's production, the company randomly samples 10 phones from a day's production to test for defects. Define the population of interest to the manufacturer.
the 10 phones sampled and tested
all the phones produced during the day in question
the 4% of the phones that are defective
the 10 responses: defective or not defective
An insurance company conducted a study to determine the percentage of cardiologists who had been sued for malpractice in the previous three years. The sample was randomly chosen from a national directory of doctors. What is the variable of interest in this study?
the doctor's area of expertise (i.e., cardiology, pediatrics, etc.)
the responses: have been sued/have not been sued for malpractice in the last three years
all cardiologists in the directory
the number of doctors who are cardiologists
A postal worker counts the number of complaint letters received by the United States Postal Service in a given day. Identify the type of data collected
qualitative
quantitative
An usher records the number of unoccupied seats in a movie theater during each viewing of a film. Identify the type of data collected
qualitative
quantitative
A fan observes the numbers on the shirts of a girl's soccer team. Identify the type of data collected.
qualitative
quantitative
A manager of a business firm predicts future sales of the company based on the present sales.
Descriptive Statistics
Inferential Statistics
A psychologist investigates if there is a significant relationship between mental age and chronological age.
Descriptive Statistics
Inferential Statistics
Number of hairs in your head
Discrete Variable
Continuous Variable
Life Span of a person
Discrete Variable
Continuous Variable
Which of the following is an example of qualitative data
number of vegetarian students
everyday temperature
number of illiterate people in India
appreciation of art
"Statistics does not help in comparison of data of different regions"
True
False
Descriptive statistics involves estimation and hypothesis testing
True
False
The purpose of descriptive statistics is to
make decision
make estimation
describe data
make hypothesis testing
Types of Statistics are:
marketing and accounting
descriptive and inferential statistic
primary and secondary
quantitative and qualitative
Inferential statistics is....
a techniques to improve the efficiency and effectiveness of the organization.
is a techniques to implement a strategic plan.
making generalization about population by analyzing the sample.
is a good representation of a population
Sample is different from population because...
a set of items selected from the population
a measuring variable for every unit in the population
a complete set
a study done before the actual framework
Example of quantitative data ..
color of eyes
types of glasses
numbers of chairs
marital status
Primary data..
second hand data
first hand information
data from other parties
annual report
It is the collection of all individuals or objects from which the required information is to be obtained.
Data
Population
Sample
Variable
A particular information of interest about the members of either the population or a sample.
Data
Population
Sample
Variable
Which of the following is an example of categorical data?
Age of Grade 7 Students
Favorite subject of Grade 7 Students
Which method of collecting data is the most appropriate for testing the effectiveness of a new vaccine?
Experimental
Interview
Observation
Questionnaire
Level of measurement where there is logical ordering or categories.
Nominal
Ordinal
Interval
Ratio
Which is an example of ratio scale?
time
gender
grades
all of these
Statistics defined as singular term refers to..
Science of designing studies ie. identify problem, gather data, summarize data, present data, analyze data and make a decision.
Numerical facts or data
Why is statistical study important?
To solve problem
Help to investigate relationship between variables
Help in making wise decision
To provide solution/option for problem based on proper statistical study
The correct steps of statistical problem solving is...
Identify problem > present data > gather data > analyze data > reach a decision
Identify problem > gather data > present data > analyze data > reach a decision
Identify problem > gather data > analyze data > present data > reach a decision
Identify problem > present data > analyze data > gather data > reach a decision
Inferential vs descriptive statistics??
1) Making statements for the population based on samples
Descriptive
Inferential
Inferential vs descriptive statistics??
4) Uses the data to provide descriptions of the population, either through numerical calculations or graphs or tables.
Descriptive
Inferential
Inferential vs descriptive statistics??
5) Draws educated conclusions about a population that is likely too large to sample completely
Descriptive
Inferential
It is the art & science of collecting, presenting, analyzing & interpreting data.
Inferential Statistics
Descriptive Statistics
Statistics
Statistic
A numerical characteristic or attribute associated with the population being studied.
Statistics
Parameter
Sample
Variable
Which of the following is not a categorical or qualitative variable?
blood type
gender
height
civil status
Which of the following is not a quantitative variable?
weight
age
height
civil status
A variable that is obtained by counting like number of patients.
Continuous Variable
Discrete Variable
Numerical-Valued or Quantitative Variable
Categorical or Qualitative Variable
It ranks individuals in terms of the degree to which they possess a characteristic.
Nominal Scale
Ordinal Scale
Interval Scale
Ratio Scale
Which of the following is not a continuous variable?
number of students
height
length
weight
It is defined as a group of people, animals, places, things, or ideas.
Statistic
Parameter
Sample
Population
It is a a numerical measure that describes a characteristic of a sample.
Statistic
Parameter
Sample
Population
True or False. Gender is a qualitative variable.
True
False
True or False. Length is a qualitative variable.
True
False
___________________ is a statistical measure to determine a single score that defines the center of a distribution
Statistics
Distribution
Central Tendency
Mathematics
__________________ is the methods of collecting, classifying, graphing, and averaging the data
Descriptive Statistics
Inferential Statistics
Statistics
Graphical
Which of the following is not an example of Descriptive Statistics?
A campaign manager analyzes the effect of TV ads on the
promotion of a senatorial candidate
The average price of houses in Laguna
A survey was conducted to know the profile of the respondents
The guard in the SM Megamall records the number of shoppers for
the past 15 days.
It is used to show roughly if relationship exists between two variables.
Line Graph
Pictograph
Bar Graph
Scatter-point Diagram
It is used to show a trend over a period of time. The dots which represent the coordinates between the x and y-axis are traced forming a line.
Line Graph
Pictograph
Bar Graph
Scatter-point Diagram
Explain the concept of statistical power in hypothesis testing.
Statistical power is the likelihood of making a Type II error.
Statistical power is the measure of sample size in hypothesis testing.
Statistical power is the probability of accepting a true null hypothesis.
Statistical power in hypothesis testing is the probability of correctly rejecting a false null hypothesis.
How do you interpret the results of a hypothesis test?
Ask a Magic 8-Ball for guidance
Compare the p-value to the significance level to determine if the null hypothesis should be rejected or not.
Flip a coin to determine the outcome
Count the number of participants in the study
Define p-value in the context of hypothesis testing.
The p-value is the probability of obtaining results as extreme as the observed results of a statistical hypothesis test, assuming that the null hypothesis is true.
The p-value is the probability of rejecting the null hypothesis.
The p-value is always equal to 0.05 in hypothesis testing.
The p-value is the same as the significance level.
What is a Type I error in hypothesis testing?
Accepting the null hypothesis when it is false
Rejecting the alternative hypothesis when it is true
Rejecting the null hypothesis when it is true
Failing to reject the null hypothesis when it is false
Explain the difference between null hypothesis and alternative hypothesis.
The null hypothesis suggests a significant difference between variables
The null hypothesis assumes no significant difference or relationship between variables, while the alternative hypothesis suggests there is a significant difference or relationship.
The null hypothesis always rejects the relationship between variables
The alternative hypothesis assumes there is no difference between variables
What is the purpose of hypothesis testing in inferential statistics?
To determine if there is enough evidence to reject a null hypothesis in favor of an alternative hypothesis based on sample data.
To determine if the sample data is 100% accurate
To prove the null hypothesis is always correct
To confuse researchers with unnecessary calculations
Draw the normal distribution and indicate the area of the MEAN, MEDIAN, and MODE.

Which of the following statements is true about the mode?
It is the value that appears most frequently in a dataset.
It is always the largest value in the dataset.
It is the average of all values.
It cannot be used with categorical data.
What are the four types of data analytics?
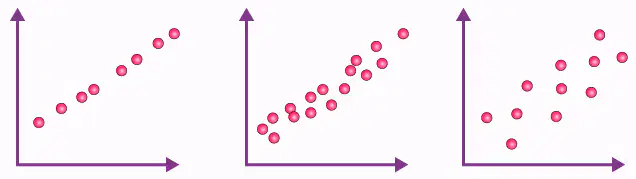
Interpret the 3 results of the correlation coefficient based on the scatter plot diagram.
What are the 2 type of analysis used to compare group means, but they differ in the number of groups they can compare

