
NEW
Font size
 Worksheets
FPS chapter 3
Total questions: 12
Worksheet time: 6mins
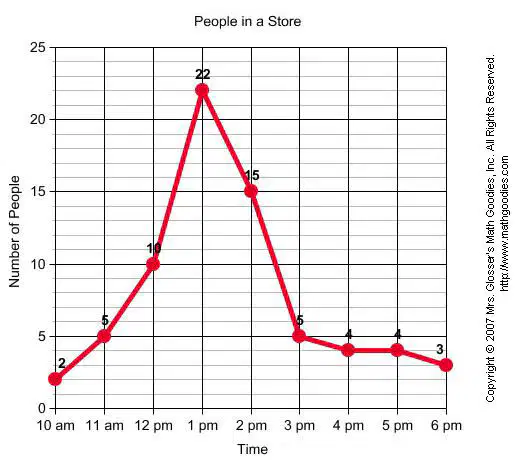
What type of graph/ chart for the following figure?
Bar chart
Pie chart
Line graph
Stem and leaf plot

What was the bear population in 2001?
40
50
60
70

Between which two years did the bear population remain constant or the same?
2004 and 2005
2005 and 2006
2001 and 2002
2000 and 2001

What is the highest speed shown?
968 mph
100.1 mph
1001 mph
100 mph

A florist records the amount of money he spent on gasoline each week to deliver orders. The list shows the data for 16 weeks.
32, 38, 40, 44, 44, 46, 49, 53, 55, 58, 62, 65, 68, 70, 72, 81
He put the data in a stem-and-leaf plot.
What number did he leave out of the stem-and-leaf plot?
21
53
39
44

How many bags of candy had exactly 55 orange candies?
3
4
5
6

In how many games did the team score more than 20 points?
6
7
8
9
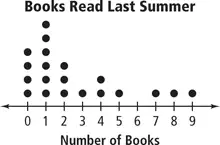
How many kids read 3,4 and 5 books?
4 kids
5 kids
3 kids
2 kids
Which of the following numbers will NOT round to 400 when rounding to the nearest hundred?
409
365
425
481
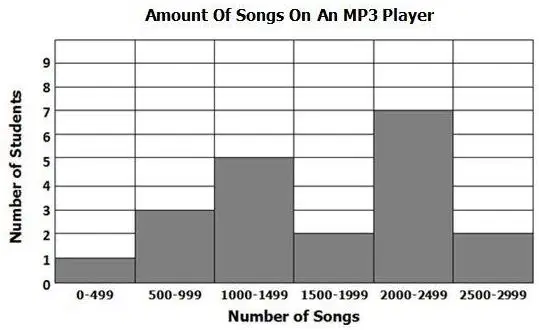
How many students have more than 1,000 songs on their MP3 player?
5
7
11
16

How many of the students had an ACT composite score of at least 20?
7
20
27
cannot be determine

How many students are represented by the histogram?
31
60
100

