
 Worksheets
Data Type & Shapes of Distribution
Total questions: 48
Worksheet time: 55mins

What is the shape of the distribution?
Skewed Left
Skewed Right
Symmetric
Uniform

What is the shape of the data?
symmetrical
Negatively Skewed
Positively Skewed
bell curve
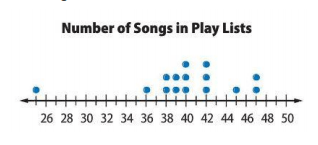
Which statement best describes this graph?
There is a peak at 47.
There is a cluster around 38-40.
The mode is 40.
There is a gap in the data between 39-40.

What numbers make up the cluster?
16-17
15-18
14-18
19-20

Is there an outlier?
No.
Yes, it is 6.
Yes, it is 4-5
Yes, it is 1-3.

What is the shape of the data?
skewed
symmetrical, bell shaped
symmetrical, bimodal

The data in this graph is...
non-symmetrical, bell shaped
non-symmetrical, u shaped
symmetrical, bell shaped
symmetrical, bimodal

Describe the shape of the distribution. Select two answers.
symmetric
skewed
bell-shaped
bimodal

Describe the shape of the distribution. Select two answers.
symmetric
skewed
bimodal

Describe the shape of the distribution. Select all that apply.
bell-shaped
bimodal
skewed left
skewed right
15, 56, 58, 60, 63, 75, 80, 80, 85
How does the outlier affect the distribution of the data?

True or false, the data is skewed.
True
False

What is the Mode of this data?
96
97
68
802

How many data items are on the plot?
16
21
22
100

Brenda counted the number of silver beads on each bracelet at Oak Grove Jewelry, the store where she works.
What is the largest number of silver beads?
80 silver beads
88 silver beads
86 silver beads
83 silver beads

What is the main purpose of a stem and leaf plot?
To list numbers in ascending order
To draw graphs of plants
To calculate the average age
To organize and display data

How many people made OVER 30 free throws?
6
7
10
15

What was the highest priced ticket?
$49
$409
$125
$402 689

Which time got 4th place in the race?
27.2secs
26.2secs
25.7secs
28.9secs

What is the cost of the cheapest lunch?
35c
$3.05c
$35.00
$3.50
science that consists of collecting, organizing, analyzing and interpreting data
data
statistics
population
sample
information gathered from observations, surveys and experiments
data
population
sample
stats
collection of ALL outcomes, responses, measurements or counts
population
sample
stats
data
collection of a subset of the population
population
sample
parameter
statistic
Weight - Is it classified as numerical or categorical?
Numerical
Categorical
Favourite animal - Is it classified as numerical or categorical?
Numerical
Categorical
Nationality - Is it classified as numerical or categorical?
Numerical
Categorical
A car salesman records information about the cars he is selling.
The colour of each car is _____ data
Qualitative
Continuous
Discrete
There are 40 sheep on a farm.
The weight of the sheep is _____ data
Qualitative
Discrete
Continuous

What type of graph is shown in the image
Histogram
Scatter
Bar
Pie

What type of data is displayed in the image
Continuous
Numerical
Categorical
Countries

What's wrong with this graph?
No numbers on each axis
No axis labels
No axis units
Best fit line is straight with equal number of points above and below
No title

The height of a tree is being measured over time. What data type does this example represent?
Categorical
Numerical: Discrete
Numerical: Continuous
Which of the following are examples of continuous data?
Room temperature
Height
Number of M&Ms in a bag
The number of days in August
What is an outlier in a data set?
A data point that is irrelevant to the data set
A data point that is within the average range of the data set
A data point that is exactly in the middle of the data set
A data point that differs significantly from other observations in the same data set.

Your math grades are 90, 85, 0, 90, 80, 100, and 90. Which grade is the outlier?
90
0
80
100

The data set below has an outlier of 42.
2, 5, 12, 15, 19, 4, 6, 11, 16, 18, 12, 12, 42
What effect does removing the outlier have on the mean?
The mean will increase.
The mean will decrease.
Population or Sample?
A survey of 1353 American households found that 18% of the households own a computer.
Population
Sample
Population or Sample?
The average weight of every person entering the mall within 3 hour period was 146 lb.
Population
Sample
Biased or unbiased:
A public library asked every 10th person who entered to name the type of book they were getting.

Casey surveyed the members of his soccer team to ask them what their favorite sport is. Is this a biased sample or unbiased sample?
Biased Sample
Unbiased Sample
To get valid results, a sample must be...
biased
unbiased
Which of these statements best describes a biased sample?
It is very small.
It is not randomly chosen.
It results in incorrect predictions.
It does not accurately represent the population.
Biased or Random?
Isaac wants to find out the favorite foods of students at Churchill. He asks the boys’ basketball team about their favorite foods.
Biased sample
Random sample

