
 Worksheets
Exemplar 17: Collect, Graph, and Interpret Data
Total questions: 13
Worksheet time: 39mins

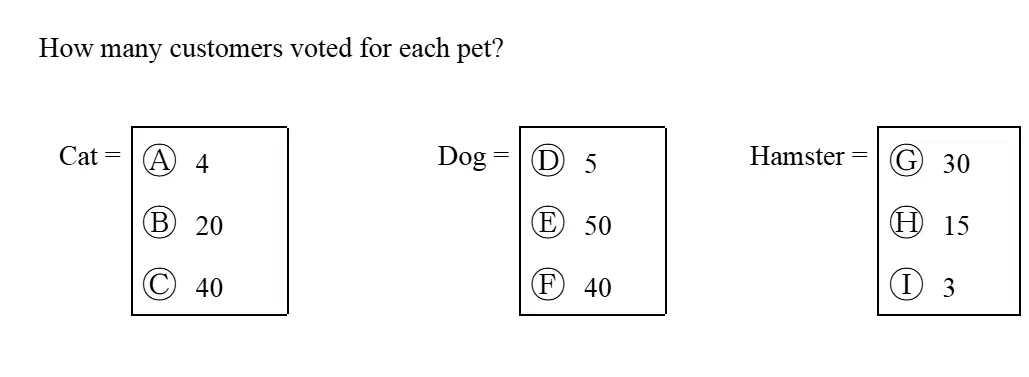
A pet store surveys its customers to find out what their favorite pet is. How many customers voted for Cat?
4
20
40
A pet store surveys its customers to find out what their favorite pet is. How many customers voted for Dog?
D. 5
E. 50
F. 40
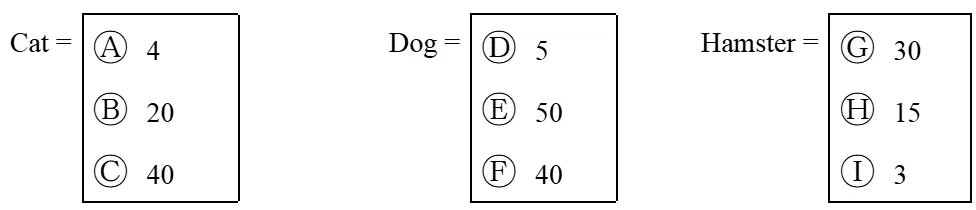
A pet store surveys its customers to find out what their favorite pet is. How many customers voted for Hamster?
G. 30
H. 15
I. 3
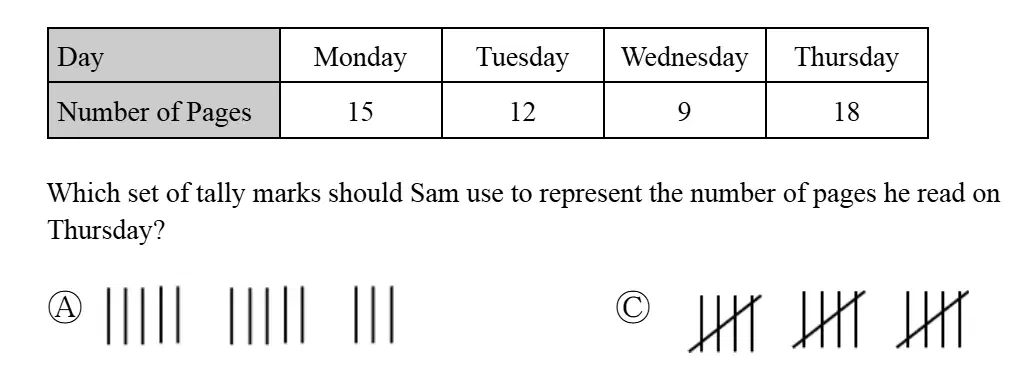
Cristian counts how many pages of a book he reads each night before going to bed. (Refer to the table of days and number of pages) Which set of tally marks should Christian use to represent the number of pages he read on Thursday?
A. 12
B. 18
C. 15
D. 9

A bagel shop keeps track of the types of bagels they sell in a day. Type of Bagel | Number Sold Cinnamon | 40 Blueberry | 15 Plain | 25 Which bar graph correctly represents the data?
A. [Bar graph A]
B. [Bar graph B]
C. [Bar graph C]
D. [Bar graph D]

How many students chose swimming and kayaking as their favorite activities?
35
20
15
50

Five more students chose swimming than which other activity?
A. Hiking
B. Kayaking
C. Fishing
D. Games
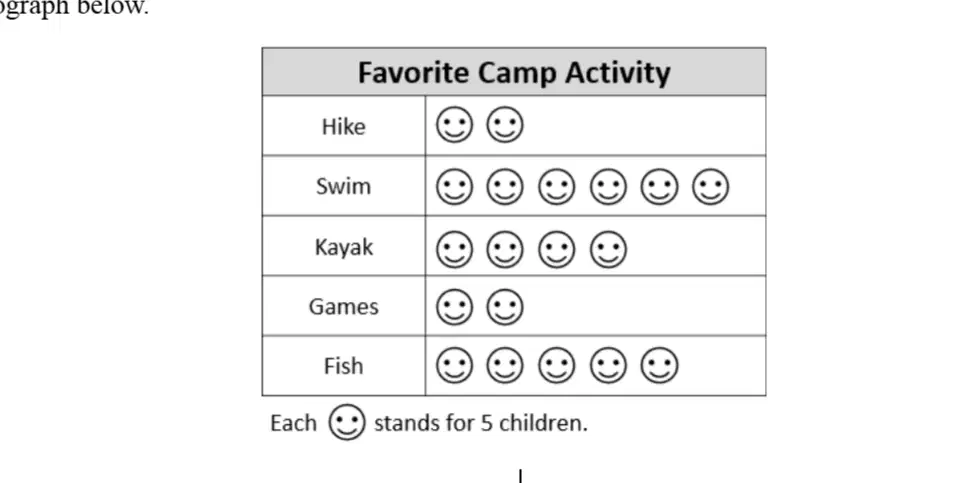
The kids at Summer Camp voted on their favorite outdoor activity. The results are shown in the pictograph below. Fill in the bubble next to the answer choice that makes the sentence true. The number of students who chose games and hiking is the same as the number of students who chose
Swimming
Kayaking
Fishing

What is the difference, in feet, of the shortest and longest throws?
(a)

How much further, in feet, did Jacob throw the football than Deshawn?
15
10
20
5
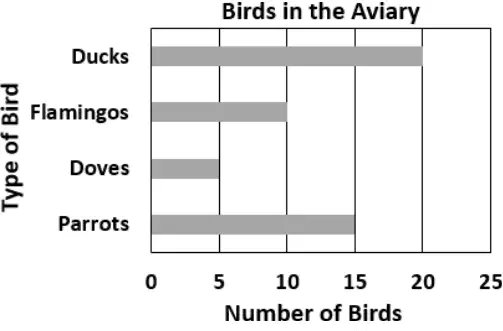
Which bar graph matches the data in the pictograph?
A.
B.
C.

A cashier counts the number of each type of coin in the cash register after the store closes. The data is shown in the bar graph below. The cashier finds two additional rolls of quarters, with 10 quarters in each roll. The cashier should shade how many more sections of the graph to show the new total?
1
2
10
20
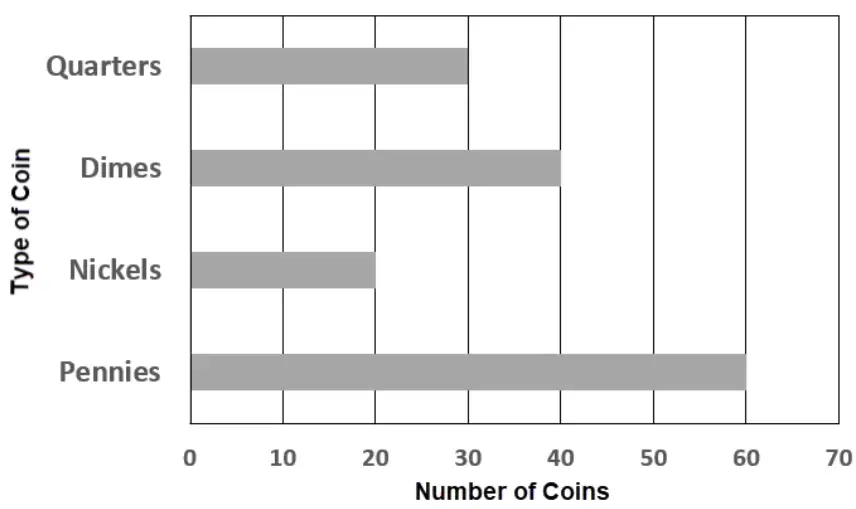
A cashier counts the number of each type of coin in the cash register after the store closes. The data is shown in the bar graph below. The cashier finds two additional rolls of quarters, with 10 quarters in each roll. The cashier should shade 2 more sections of the graph to show that there are how many quarters in all?
E. 5
F. 30
G. 50

