
 Worksheets
Inference BIG REVIEW
Total questions: 121
Worksheet time: 8hrs 4mins

The two data sets show the number of days that team members trained before a 5k race. What inference can you draw by comparing the data?
There is more variability in the number of days that Team A members trained because the IQR for Team A is greater than the IQR for Team B.
There is more variability in the number of days that Team B members trained because the IQR for Team B is greater than the IQR for Team A.
Team A members generally trained for the same amount of days as Team B members
Team B members generally trained for more days than Team A members

What inference can you draw by comparing the data?
There is more variability in the number of days that Team A members trained because the range for Team A is greater than the range for Team B.
75% of Team A's training was between 5 and 20 days.
The interquartile range of Team B is about 20 days.
Team A generally spends more time training since they have a higher median.
7. A public library asked every 10th person who entered to name the type of book they were getting
Biased
Unbiased

Who has a greater median?
Zach
Steven
They have the same median


Which two measures of center are most similar using the data shown?
mean and median
mean and mode
median and mode
the mean, median, and mode are all the same
What is the difference between the maximum number of hours that Zach and Steven have spent on their homework?
0.5
0.75
2.5
3

The graph shows the amount Michael earned while working for eight days. Which day’s amount is closest to the range for the eight days?
Day 1
Day 3
Day 6
Day 7
Lions: 62, 58, 70, 45, 62, 60, 48, 55, 44
Bears: 54, 72, 65, 48, 26, 81, 59, 60 ,57
Compare the means.
If you want to get a general idea of the type of food the general population prefers, which sample group should you survey?
The 8th grade students
Customers at a sushi bar
People at the mall
Waiters at a steak house


Paul and Denise will collect data to find out where the 7th grade class should hold their end-of-the-year picnic.
Which group should Paul and Denise survey to collect the best data?
30 of their friends
all of the students on the baseball team
the first 20 students in the lunch line
10 randomly selected students from each of the four 7th grade classrooms

Two random samples of 100 Americans were surveyed about their favorite television programs.
What can be inferred from the data?
A total of 25 Americans prefer dramas.
More Americans prefer comedy than drama.
More Americans prefer sports than comedy and drama combined.
47% of Americans prefer comedy.

Lance surveyed his class to see how many students have pets. The results are shown in the table.
Which statement is true?
Over 1/2 of students own a dog.
Exactly 12% of students do not own a dog.
About 1/4 of students own a hamster.
About 20% of students own either a hamster or fish.

Basketball teams play 12 games each season. Two teams track their scores for each game in a line plot.
Which statement can be determined using the data in the line plots?
The data from the Bulls shows more variation.
The data from the Spartans shows more variation.
The data from the Bulls and Spartans scores show the same variation.
Not enough information is given to determine variation.

The ages of the people at two tables in a restaurant are shown in the chart.
Which statement about the range of the data sets is true?
The range of ages at Table 1 is 1 year greater than the range of ages at Table 2.
The range of ages at Table 1 is 2 years greater than the range of ages at Table 2.
The range of ages at Table 2 is 1 year greater than the range of ages at Table 1.
The range of ages at Table 1 is equal to the range of ages at Table 2.

Victoria compares her math test scores to her science test scores. Use the data to answer the question.
By how many points is Victoria's mean math score GREATER than her mean science score?
5
4
3
2

Mrs. Haywood made dot plots of her 2 math classes' recent math tests.
Which statement is true?
All of the students in 1st period did worse than the students in 2nd period.
Most students scored a 75 or 80.
There were students in 1st period that scored higher than students in 2nd period.
Most students scored an 85 of better.

The table shows the number of points scored by Jarod and Billy in the first five games of the season.
What is the difference in average points per game between Jarod and Billy?
10
12
22
32
Liz conducted a survey of the number of kids in her school who would join a charity work club if she started one. She surveyed 75 kids and 30 said they would join. If there were 165 kids in her grade, how many could she expect to join?
66
23
132
46
A sample should be _____________
Less than ten in the general population
The entire population
Not representative of the general population
Representative of the general population
A poll was taken of Hobby Middle School, 25 out of 30 students said they would prefer pizza on Friday’s. Out of 1200 students, what is a reasonable prediction of how many students would prefer pizza on Fridays?
100
1000
10
1
To determine what people think about the construction of a new school, the school board asks citizens to call a certain number and express their opinions. Describe the sample used by the school board.
Systematic
Simple Random
Convenience
Voluntary Response
To determine if a certain assembly line is producing quality radios, an employee checks every thirtieth radio leaving the assembly line. Describe the sample used by the employee.
Systematic
Simple Random
Convenience
Voluntary Response
To determine who the voters will chose for governor, five voters picked at random from each county of the state are surveyed. Describe the sample used.
Systematic
Simple Random
Convenience
Voluntary Response
To determine what students want served in the cafeteria, the cook asks students in Ms. Andrews’ first period class. Describe the sample used.
Systematic
Simple Random
Convenience
Voluntary Response


The student government wants to survey the student body about whether they would like a vegetarian entree added to the daily lunch menu in the cafeteria. Which sample is most likely to be representative of the opinion of the entire school.
Survey the first 30 students in the cafeteria line at lunch.
Select 30 students randomly in the hallway during the change of periods.
Survey all the students in the Animal Rights Club.
Select 30 students randomly from among the students who bring their lunch to school 3 or more times a week.
Paul and Denise will collect data to find out where the 7th grade class should hold their end-of-the-year picnic.
Which group should Paul and Denise survey to collect the best data?
30 of their friends
all of the students on the baseball team
the first 20 students in the lunch line
10 randomly selected students from each of the four 7th grade classrooms
Two random samples of 100 Americans were surveyed about their favorite television programs.
What can be inferred from the data?
A total of 25 Americans prefer dramas.
More Americans prefer comedy than drama.
More Americans prefer sports than comedy and drama combined.
47% of Americans prefer comedy.
The heights of five ambrosia plants, in inches, selected at random from a park with 50 ambrosia plants are shown below.
78, 118, 157, 39, 98
Which is a reasonable prediction of the mean height of all the ambrosia plants in the park?
9.8 inches
39 inches
98 inches
157 inches
Dr. Gilmore's research group tagged and released 800 squirrels for a study of a local park. Later, they trapped 430 squirrels, 43 of which had tags.
To the nearest whole number, what is the best estimate for the squirrel population?
43
80
370
8000
Lance surveyed his class to see how many students have pets. The results are shown in the table.
Which statement is true?
Over 1/2 of students own a dog.
Exactly 12% of students do not own a dog.
About 1/4 of students own a hamster.
About 20% of students own either a hamster or fish.
Basketball teams play 12 games each season. Two teams track their scores for each game in a line plot.
Which statement can be determined using the data in the line plots?
The data from the Bulls shows more variation.
The data from the Spartans shows more variation.
The data from the Bulls and Spartans scores show the same variation.
Not enough information is given to determine variation.
The ages of the people at two tables in a restaurant are shown in the chart.
Which statement about the range of the data sets is true?
The range of ages at Table 1 is 1 year greater than the range of ages at Table 2.
The range of ages at Table 1 is 2 years greater than the range of ages at Table 2.
The range of ages at Table 2 is 1 year greater than the range of ages at Table 1.
The range of ages at Table 1 is equal to the range of ages at Table 2.
Victoria compares her math test scores to her science test scores. Use the data to answer the question.
By how many points is Victoria's mean math score GREATER than her mean science score?
5
4
3
2
Mrs. Haywood made dot plots of her 2 math classes' recent math tests.
Which statement is true?
All of the students in 1st period did worse than the students in 2nd period.
Most students scored a 75 or 80.
There were students in 1st period that scored higher than students in 2nd period.
Most students scored an 85 of better.

The test scores of five randomly selected students in Mr. Robertson's first and third period classes are shown in the chart.
Which statement about the means of the data sets is true?
The mean score in the Period 1 group is 1 point greater that the mean score in the Period 3 group.
The mean score in the Period 3 group is 1 point greater that the mean score in the Period 1 group.
The mean score in the Period 3 group is 6 points greater that the mean score in the Period 1 group.
The mean score in the Period 1 group is equal to the mean score in the Period 3 group.

The test scores of five randomly selected students in Mr. Robertson's first period and third period classes are shown in the chart.
Which statement about the medians of the data set is true?
The median score in the Period 1 group is 5 points greater that the median score in the Period 3 group.
The median score in the Period 3 group is 5 points greater that the median score in the Period 1 group.
The median score in the Period 3 group is 6 points greater that the median score in the Period 1 group.
The median score in the Period 1 group is equal to the median score in the Period 3 group.

The size of 8 lots in a new neighborhood are listed in the table.
Which BEST describes the typical lot size in the new neighborhood?
mean
median
mode
range
The table shows the number of points scored by Jarod and Billy in the first five games of the season.
What is the difference in average points per game between Jarod and Billy?
10
12
22
32
250 people were surveyed about the favorite color. 14 prefer yellow, 32 prefer red, 64 prefer purple, 46 prefer blue, 54 prefer orange and 40 prefer green. If you were to survey 32000 people, how many would you expect to choose purple?
5888
5000
7524
8192
What is the difference between the mean WITH the outlier and the mean WITHOUT the outlier:
9, 18, 12, 42, 15
19.2
16.5
13.5
5.7
If you want to get a general idea of the type of food the general population (of ALL ages) prefers, which sample group should you survey?
8th grade students
customers at a sushi bar
people in a grocery store
waiters in a steak house

What is the difference between the averages of the two groups?
53,681,980.5
51,331,085.5
105,013,066
2,350,895

What is the range
5
8
10
11

What is the mean
6.2
7.5
6
5
What is the median
4.5
4
5
9
What is the mode
none
1
9
8

A movie theater kept track of the attendance on Fridays and Saturdays. The results are shown in the box plots.
Which conclusion can be drawn from the box plots?
Friday had better attendance and the attendance was more consistent.
Saturday had better attendance but Friday's attendance was more consistent.
Friday had better attendance but Saturday's attendance was more consistent.
Saturday had better attendance and the attendance was more consistent.

Math has a higher median and greater variability than science.
Math has a higher median but less variability than science.
Science has a higher median and greater variability than math.
Science has a higher median but less variability than math.

1.) There are 1,942 students at West High School. Use the information in the table to determine how many students study less than 2 hours each day.
68
680
689
699
Liz conducted a survey of the number of kids in her school who would join a charity work club if she started one. She surveyed 75 kids and 30 said they would join. If there were 165 kids in her grade, how many could she expect to join?
66
23
132
46
A sample should be _____________
Less than ten in the general population
The entire population
Not representative of the general population
Representative of the general population
To determine what people think about the construction of a new school, the school board asks citizens to call a certain number and express their opinions. Describe the sample used by the school board.
Systematic
Simple Random
Convenience
Voluntary Response
To determine if a certain assembly line is producing quality radios, an employee checks every thirtieth radio leaving the assembly line. Describe the sample used by the employee.
Systematic
Simple Random
Convenience
Voluntary Response
To determine who the voters will chose for governor, five voters picked at random from each county of the state are surveyed. Describe the sample used.
Systematic
Simple Random
Convenience
Voluntary Response
To determine what students want served in the cafeteria, the cook asks students in Ms. Andrews’ first period class. Describe the sample used.
Systematic
Simple Random
Convenience
Voluntary Response
If you want to get a general idea of the type of food the general population (of ALL ages) prefers, which sample group should you survey?
8th Grade Students
Customers at a sushi bar
People in a grocery store
Waiters at a steak house
Which of the following is a way in which statistics are made to be misleading?
The scale is altered on a graph.
All three measures of central tendency are presented.
The actual data are shown, and you are allowed to figure out the measures of central tendency on your own.
Outliers on data are brought up and their effects on the measures of central tendency are explained.
If you have taken five English tests this quarter and received scores of 72, 72, 93, 94, and 95, what misleading statistic could you use to make your grades look better than they are?
mean
median
mode
range
A city has a population of 100000 people. Between the ages of 21-29 there are 30000 people, people between the age of 30-39 are 34000 people, between the age of 40-49 there are 27000 people, and between the age of 50-59 there are 600 people. A survey is given to 9000 people each day.
For Monday, ages of 21-29 had 30, age of 30-39 had 34, age of 40-49 had 27, and age of 50-59 had 9.
For Tuesday, ages of 21-29 had 10, age of 30-39 had 20, age of 40-49 had 40, and age of 50-59 had 30.
For Wednesday, ages of 21-29 had 9, age of 30-39 had 34, age of 40-49 had 27, and age of 50-59 had 30.
For Thursday, ages of 21-29 had 10, age of 30-39 had 40, age of 40-49 had 20, and age of 50-59 had 30.
Which day surveyed a sample that is the best representation of the people in the city?
Monday
Tuesday
Wednesday
Thursday

A survey of 500 people was completed on students’ favorite subject.
If there are 9,000 students in Peachtree Ridge Cluster, predict how many students might like Math the most.
1584
488
1620
1462
Josh thinks that 1500 people will prefer math and Brandy thinks 1600 people will prefer math. Who made the better prediction?
Brandy made a better choice because her suggestion is closest to the prediction
Josh made a better choice because his suggestion is closest to the prediction
Neither person is better because both suggested values that are not close to the predicted amount
Both are correct because they are both equally close to the predicted amount.

The table shows the number of boys and girls that choose answer choices A, B, C, D, or E.
Which measure of center is most similar when comparing the number of boys to the number of girls?
mean
median
mode
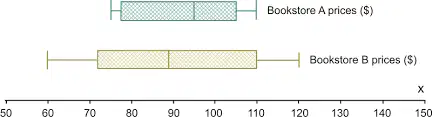
What's the median for Bookstore A and Bookstore B?
A has a median of 95 and B has a median of 89
A has a median of 89 and B has a median of 95
A has a median of 35 and B has a median of 60
A has a median of 60 and B has a median of 35
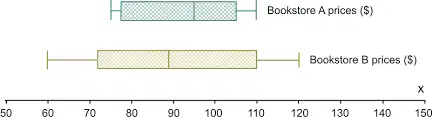
What is the different between the medians?
6
25
8
23
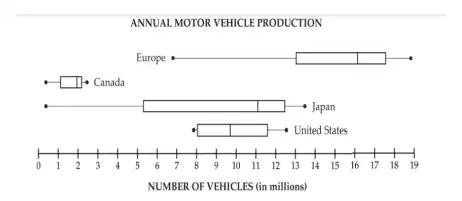
Which statement is true?
Canada has a smaller variability than the United States
United States has a greater range than Japan
The interquartile range of Europe is 10
50% of Japan's production is between 3 and 14 million.
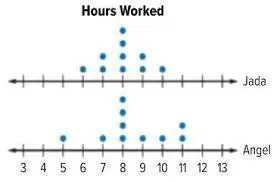
Which group's median is less than it's mean and by how much?
Angel's median is less than her mean by 0.5
Jada's median is less than her mean by 0.5
Both girls have a median that is more than their mean
Both girls have a median that is equal to their mean
Kyle has grades of 75, 82, 78, and 86.
Ben has grades of 80, 85, 79, and 76.
Who has a higher average?
Kyle with an 80.25
Ben with a 80
Kyle with a 80
Ben with a 80.25
Kyle has grades of 75, 82, 78, and 86.
Ben has grades of 80, 85, 79, and 76.
If both boys receive a 95 on their next grade, who will see the greater increase in their grade?
Ben because his grade is lower so he will improve more
Kyle because his grade is higher so he will improve more
Ben because his grade is higher so he will improve more
Kyle because his grade is lower so he will improve more
Northbrook Middle School is trying to determine which type of afterschool sport should be created for the school: football or a tennis. The school will take a survey to determine which option students prefer.
Which sample would provide the random sampling?
All students that are 6th grade
All students that bring lunch
Half of the students that play football during PE
Every fifth student that comes to school
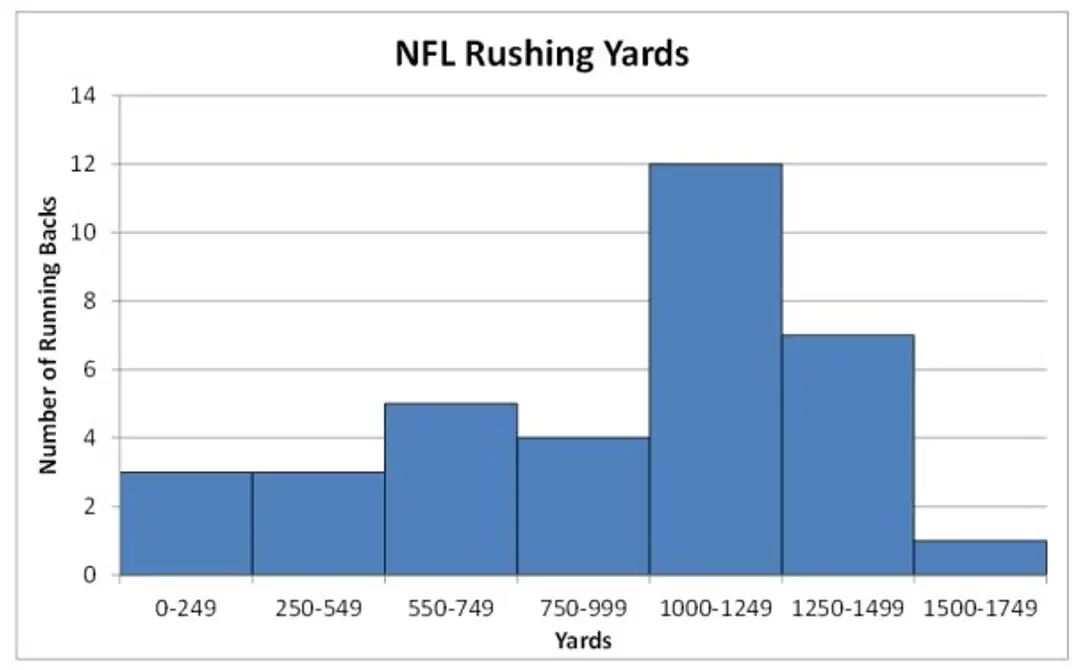
Which statement about the histogram is true?
The range from 550-749 is about two time the range from 0-249.
There are more in the 250-549 range than in the 0-249 range.
The range in the 1000-1249 is three times as much as the range in the 750-999
The range in the 250-549 is equal to the range in 1500-1749
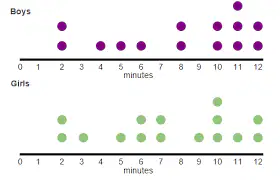
What is the difference in the means?
0.53
15.47
1
3.2

A
B
C
D

If 300 students were polled...
100
150
250
200

A
B
C
D

40
24
20
16
A survey of 150 students shows that the school would like to get rid of lockers. Which statement is true?
The sample is 150 students and the population is all the school
The sample is all the school and the population is the 150 students
The sample is the teachers and the population is the students
The sample is the students and the population is the teachers
Tammy wants to figure out what percent of students prefer which sport. What is the best group to survey?
100 people in baseball
100 people on Facebook
100 random students on the school roster
100 people that first come to school
A company wants to figure out which product is the most favored by their youngest clients. Which method of surveying will produce the most representative sample?
Posting a poll on their website
Mailing a survey to all the homes within 50 miles of their company
Randomly calling clients off their client list
Ask people that come into their store at 12 pm.
The following information represents the heights (in inches) for a group of boys and a group of girls.
Boys: 67, 65, 71, 68, 68, 70, 68, 64
Girls: 60, 62, 61, 59, 65, 62, 66, 64
Find the means and the ranges for each group and make a comparison.
Boys have a larger mean but the ranges are equal
Girls have a larger mean but equal ranges
Both means are equal and ranges are equal
Boys have a larger mean but a smaller range

Find the Mean Absolute Deviation: 5, 11, 2, 7, 16. Round to the nearest tenth.

