
 Worksheets
Ecosystems Test
Total questions: 15
Worksheet time: 30mins
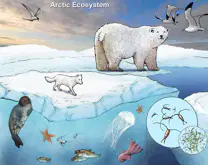
A team of fourth grade students were tasked with developing a model to describe the roles of animals in a community. The students created the following model of an arctic ecosystem. Using the model, which of the following best describes the role of the polar bear?
The polar bear is a consumer because it eats small fish.
The polar bear is a producer because it makes its own food.
The polar bear is a decomposer because it eats the seals.
The polar bear is a producer because it eats the bacteria.
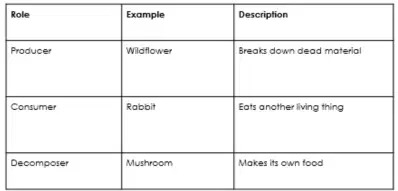
A student made the following chart to describe the roles of animals in a forest ecosystem. Another classmate reviewed the chart to give feedback. Which of the following would be the BEST feedback the student should give?
The description for a consumer needs to change to eat another living animal. They do not eat plants. Therefore, the rabbit is not a consumer.
The description for producers and decomposers should be swapped. A producer makes its own food and a decomposer breaks down dead material.
The description for a decomposer needs to change to make its own food after breaking down dead material. An example of a decomposer is a hawk.
The description for consumer and decomposers should be swapped. A consumer makes its own food and a decomposer eats another living thing.
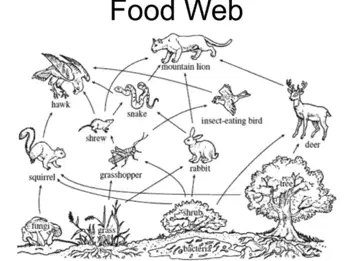
The diagram illustrates a food web and the flow of energy from one organism to another. Which organisms BEST represent the END of the flow of energy and why?
The lion, the hawk, and the deer because they are at the top of the web.
The lion, the squirrel, and the rabbit because they are separate from all the others.
The lion and the hawk because they do not provide energy for any other organism.
The lion and the deer because they are the strongest animals.
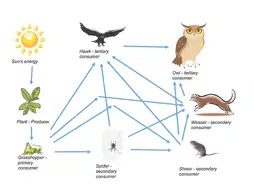
The diagram shows a prairie food web. In this food web, which of the following shows where energy is created?
Sun
Prairie grass
Plant seeds
Deer
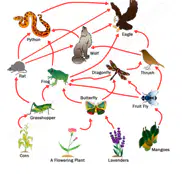
Farmers grow a lot of corn to provide a large quantity of food around the world. How could growing corn affect the forest ecosystem?
If too much corn is taken out of the ecosystem, the mangos, another competing producer population would also go down.
If too much corn is taken out of the ecosystem, the consumer, the grasshopper, population would also go down.
If too much corn is taken out of the ecosystem, the rest of the ecosystem will remain unaffected.
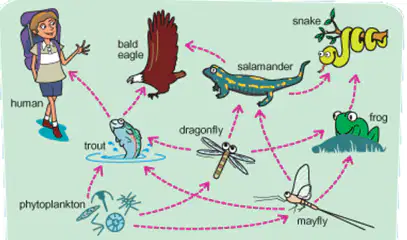
In a pond ecosystem, a disease killed many of the dragonflies. Which of the following is most likely to occur after this happens?
The number of salamanders will decrease.
The phytoplankton population will decrease.
The mayfly population will decrease.
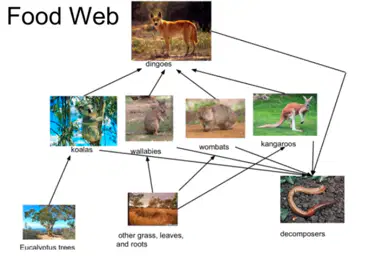
A student made a model of a food web in Australia. A widespread forest fire burned down most of the eucalyptus trees. How would this affect the community?
The community would remain unaffected. There is still another producer that the consumers can all eat.
The koala population would also go down because they would have no food to eat, but the rest of the ecosystem will be unaffected.
The koala population would also go down because they would have no food to eat, therefore, also decreasing the dingo population since they would have less koalas to eat.
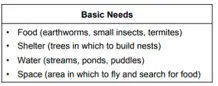
The table shows the basic needs of a robin. Which environmental change would be harmful to the survival of a robin?
Prairie dogs digging tunnels in the ground.
Beavers building a dam to create a pond.
Humans cutting down trees to build houses.
Ants building large anthills in a schoolyard.
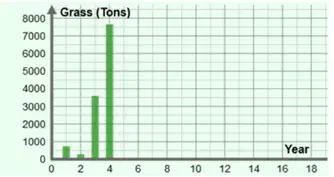
Two years of dry weather were followed by 2 rainy years, causing the grass population to rise. How will the increase in grass affect the animal population?
In the years 1 and 2, the animal population will increase while the grass production decreases.
In the years 1 and 2, the grass population and animal population increased.
In the years 3 and 4, the grass population and animal population increased.
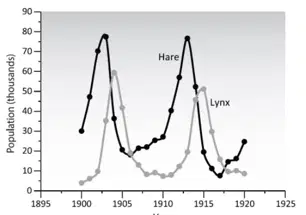
The graph shows the sizes of two populations: hare (prey) and lynx (predator). Using the graph, which statement describes the changes in the ecosystem between 1910-1913?
When the population of the hare became over-abundant, the population of the lynx also increased.
When the population of the hare became scarce, the population of the lynx increased.
When the population of the hare became scarce, the population of the lynx stayed stable.
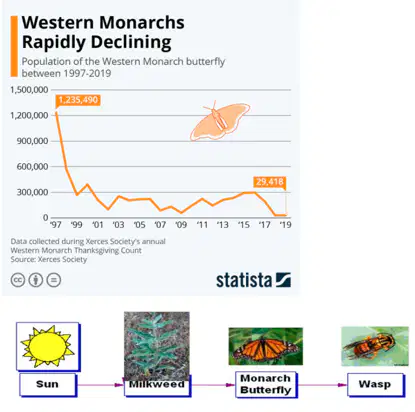
Using the two sets of data, which explanations BEST describes the changes in the flow of energy in the ecosystem?
The monarch butterfly population is currently extinct, which means that wasps will have no food supply and will also go extinct.
The monarch butterfly population is currently over-abundant, which means that wasps will have more food supply and will also become over-abundant
The monarch butterfly is currently scarce,which means that wasps will have less food supply and will also become scarce.
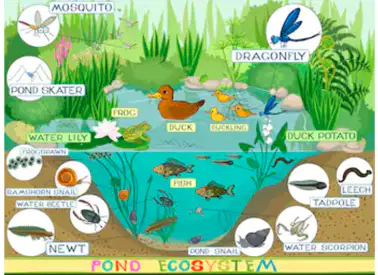
Which of the following best describes the role of the water lily (flower)?
The water lily is a consumer because it consumes water to live.
The water lily is a producer because it makes its own food.
The water lily is a decomposer because it eats dead materials.
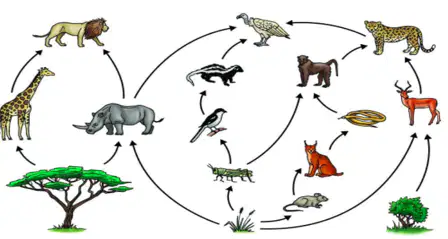
The diagram shows a food web and the flow of energy from one organism to another. Which organisms provide energy for the PLANTS?
All of the animals that are shown. When they die and are decomposed, their nutrients return to the earth.
None of the animals. The plants get their energy from the nutrients already in the earth.
None of the animals. Plants get their energy from the sun.
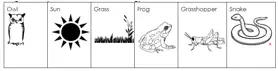
Using the organisms and sun in the picture, a student must create a model that best illustrates the flow of energy through a food chain. Which sequence BEST illustrates the flow of energy?
Owl → sun → grass → frog → grasshopper → snake
Sun → grass → grasshopper → frog → snake → owl
Sun → grass → frog → grasshopper → snake → owl
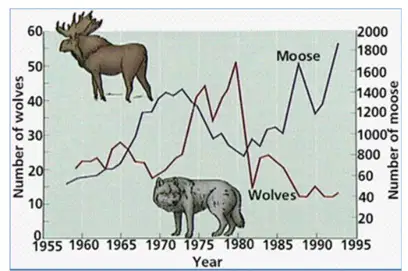
The graph shows the sizes of two populations: moose (prey) and wolf (predator). Using the graph, which statement describes the changes in the ecosystem between 1965-1970 and between 1985-1990?
The population of wolves decrease, and the population of moose decrease.
The population of the wolves increase, and the population of moose increase.
The population of wolves decrease, so the population of moose increase.

