
NEW
Font size
 Worksheets
2-Variable Statistics
Total questions: 20
Worksheet time: 2hrs 1mins
Which graph shows a line that best fits the data?


is y= 1/2x +1
How many laps can a bicycle
make around the park in
23 minutes?

Which of the following best describes the correlation shown on the graph?
negative correlation
positive correlation
no correlation

Which of the following best describes the correlation shown on the graph?
negative correlation
positive correlation
no correlation

Which of the following best describes the correlation shown on the graph?
negative correlation
positive correlation
no correlation

Which of the following best describes the correlation shown on the graph?
negative correlation
positive correlation
no correlation
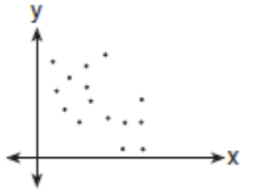
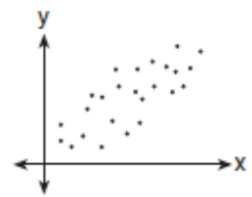
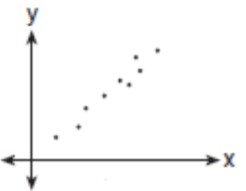
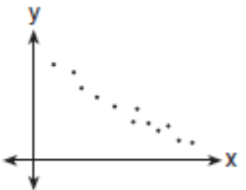
Which graph depicts the strongest positive correlation?


If the correlation coefficient, r, of a data set is r = 0. 32. What type of correlation does the data have?
Strong Positive
Strong negative
Weak Postive
Weak Negative
No correlation
Which graph represents data that has a correlation coefficient close to -1?
The linear model to represent the distance (in miles) traveled given the time (in hours) driving is
m=−1.79+61.93h . Predict how far a person will travel driving 10 hours.617.51 miles
621.09 miles
100 miles
0.19 miles

What percent of female athletes surveyed play basketball?
16%
52%
23%
31%

This table shows the number of female and male students in each science class. How many students are taking biology?
18
8
80
26



What percent was 10th graders who liked SqaureBob SpongePants?
6%
10%
50%
15%

