
 Worksheets
Chapter 4 & Chapter 8 Test
Total questions: 19
Worksheet time: 10mins
Name
Class
Date
1.
A(n) age structure diagram/population pyramid is created by
a)
calculating the number of children a woman gives birth to in her lifetime
b)
graphing the distribution of ages in a population at a specific time
c)
studying a group of people and noting when every single member dies
d)
estimating the demand for services within a community
2.
The average number of years an individual is predicted to live is called
a)
carrying capacity
b)
life expectancy
c)
growth rate
d)
demography
3.
The number of organisms that an environment can support is called the
a)
life expectancy
b)
demography
c)
carrying capacity
d)
growth rate
4.
Every spring, many species of birds travel north to the Arctic to breed, and in the fall travel south again for the winter. This is an example of
a)
immigration
b)
emigration
c)
migration
d)
population growth
5.

What kind of population distribution is displayed below by the starfish?
a)
random
b)
clumping
c)
uniform
d)
crowded
6.
A caribou is adapted to live in cold tundra environments. It would not be able to survive in a hot tropical forest because it's ___________ would change.
a)
community
b)
population
c)
population structure
d)
habitat
7.
An example of a density-dependent limiting factor is
a)
a tornado
b)
an earthquake
c)
the amount of food available
d)
a flood
8.
Which of the following would cause population to increase in a region?
a)
increased death rates
b)
decreased survivorship
c)
increased immigration
9.
People living in developed countries have longer life expectancies mainly because they have access to
a)
healthcare
b)
fuelwood
c)
more land
d)
more diverse food choices
10.
An example of a density independent limiting factor would be
a)
a hurricane
b)
infectious disease
c)
sudden arrival of a predator species
d)
old age
11.
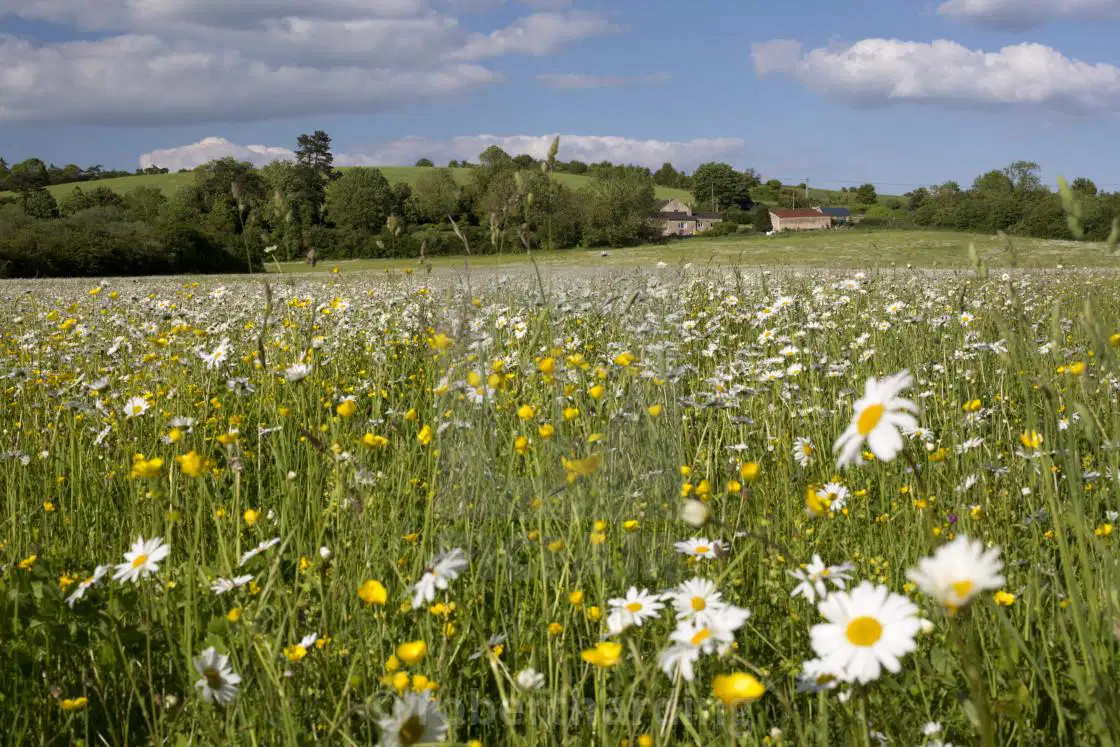
The best strategy for estimating the number of individual plants in a grassland area is by
a)
counting every individual flower
b)
direct observation
c)
mark and recapture
d)
random sampling
12.
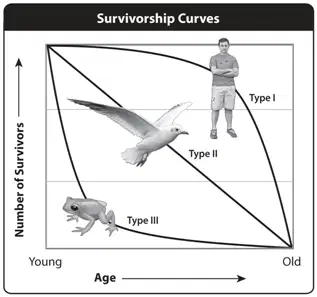
On a beach in Hawaii, you observe a hatching of sea turtles. Hundreds of baby turtles climb out of nests in the sand and flop towards the sea. As they cross the beach, dozens are caught by predators and eaten. Which type of survivorship curve do you think the sea turtles display?
a)
type I (individuals die at older ages)
b)
type II (individuals have equal chance of dying at any stage of life)
c)
type III (individuals die at younger ages)
d)
none of the above
13.
A grassland experiences a drought that causes most of the plants to die and several watering holes to dry up. The antelope that live on the grassland experience a decrease in population because water and plants are key
a)
biotic factors
b)
abiotic factors
c)
resources
d)
habitats
14.
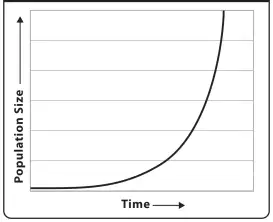
The graph below represents
a)
carrying capacity
b)
logistic growth
c)
limiting factors
d)
exponential growth
15.
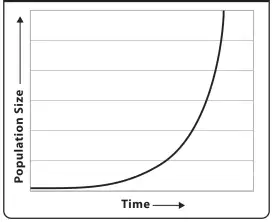
In the graph below, as time goes on, populations
a)
will increase
b)
will decrease
c)
will fluctuate rapidly
d)
will remain the same
16.

Which survivorship curve describes populations whose death rates are highest at OLD ages?
a)
type 1
b)
type 2
c)
type 3
d)
all of the above
17.
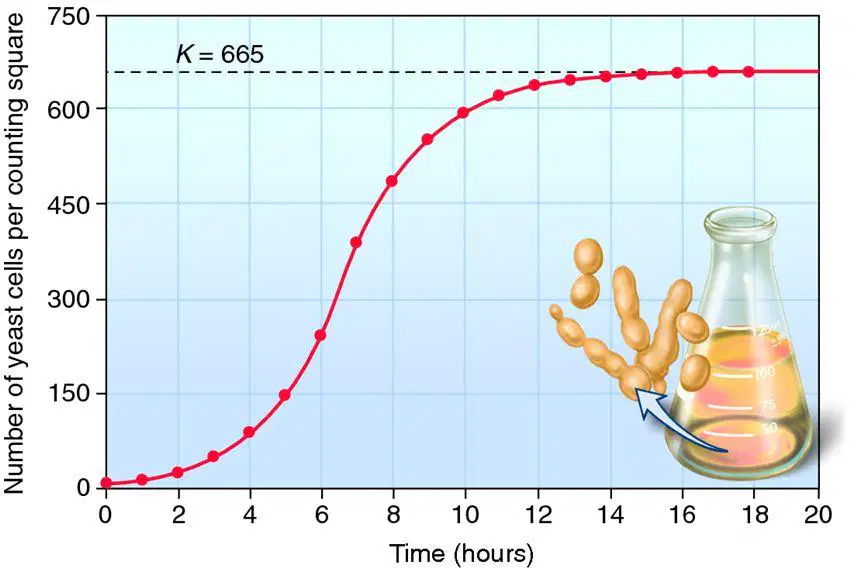
The carrying capacity of yeast cells is 665. At which hour did the yeast cells first reach carrying capacity?
a)
4 hours
b)
10 hours
c)
14 hours
d)
20 hours
18.
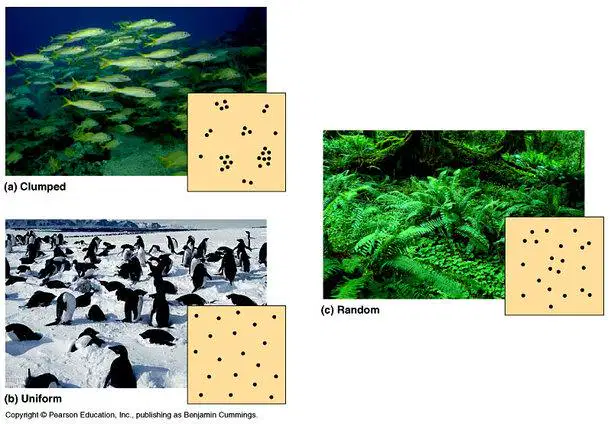
Which population distribution is the most common in nature?
a)
clumped
b)
uniform
c)
random
19.
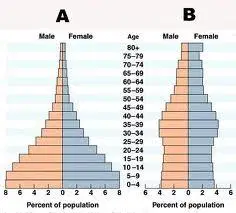
In the age structure diagrams (population pyramids), which diagram represents a population that is likely to grow rapidly in the future?
a)
A
b)
B
c)
A and B
100 %

