
 Worksheets
Unit 7 Review
Total questions: 243
Worksheet time: 10hrs 49mins






23, 34, 27, 7, 30, 26, 28, 31, 34
Find the mode of these numbers:
4,3,6,4,3,6,6,3,2,1,3
3
6
4
2



12,10,10,10,13,12,11,13,10
The mode is the number ________________________.
you see most
you see least
you don't see
you see first
What is the RANGE of these numbers? 3, 7, 9, 10
(a)
Find the average (mean) of these numbers.
10, 3, 2, 5
5
4
10
3
The range is found by finding the _______________ number and subtracting the ________________ number.
smallest, biggest
even, odd
biggest, smallest
middle, first





How many more did Ima Stuft eat than R.U. Fuller?
1
4
20
3
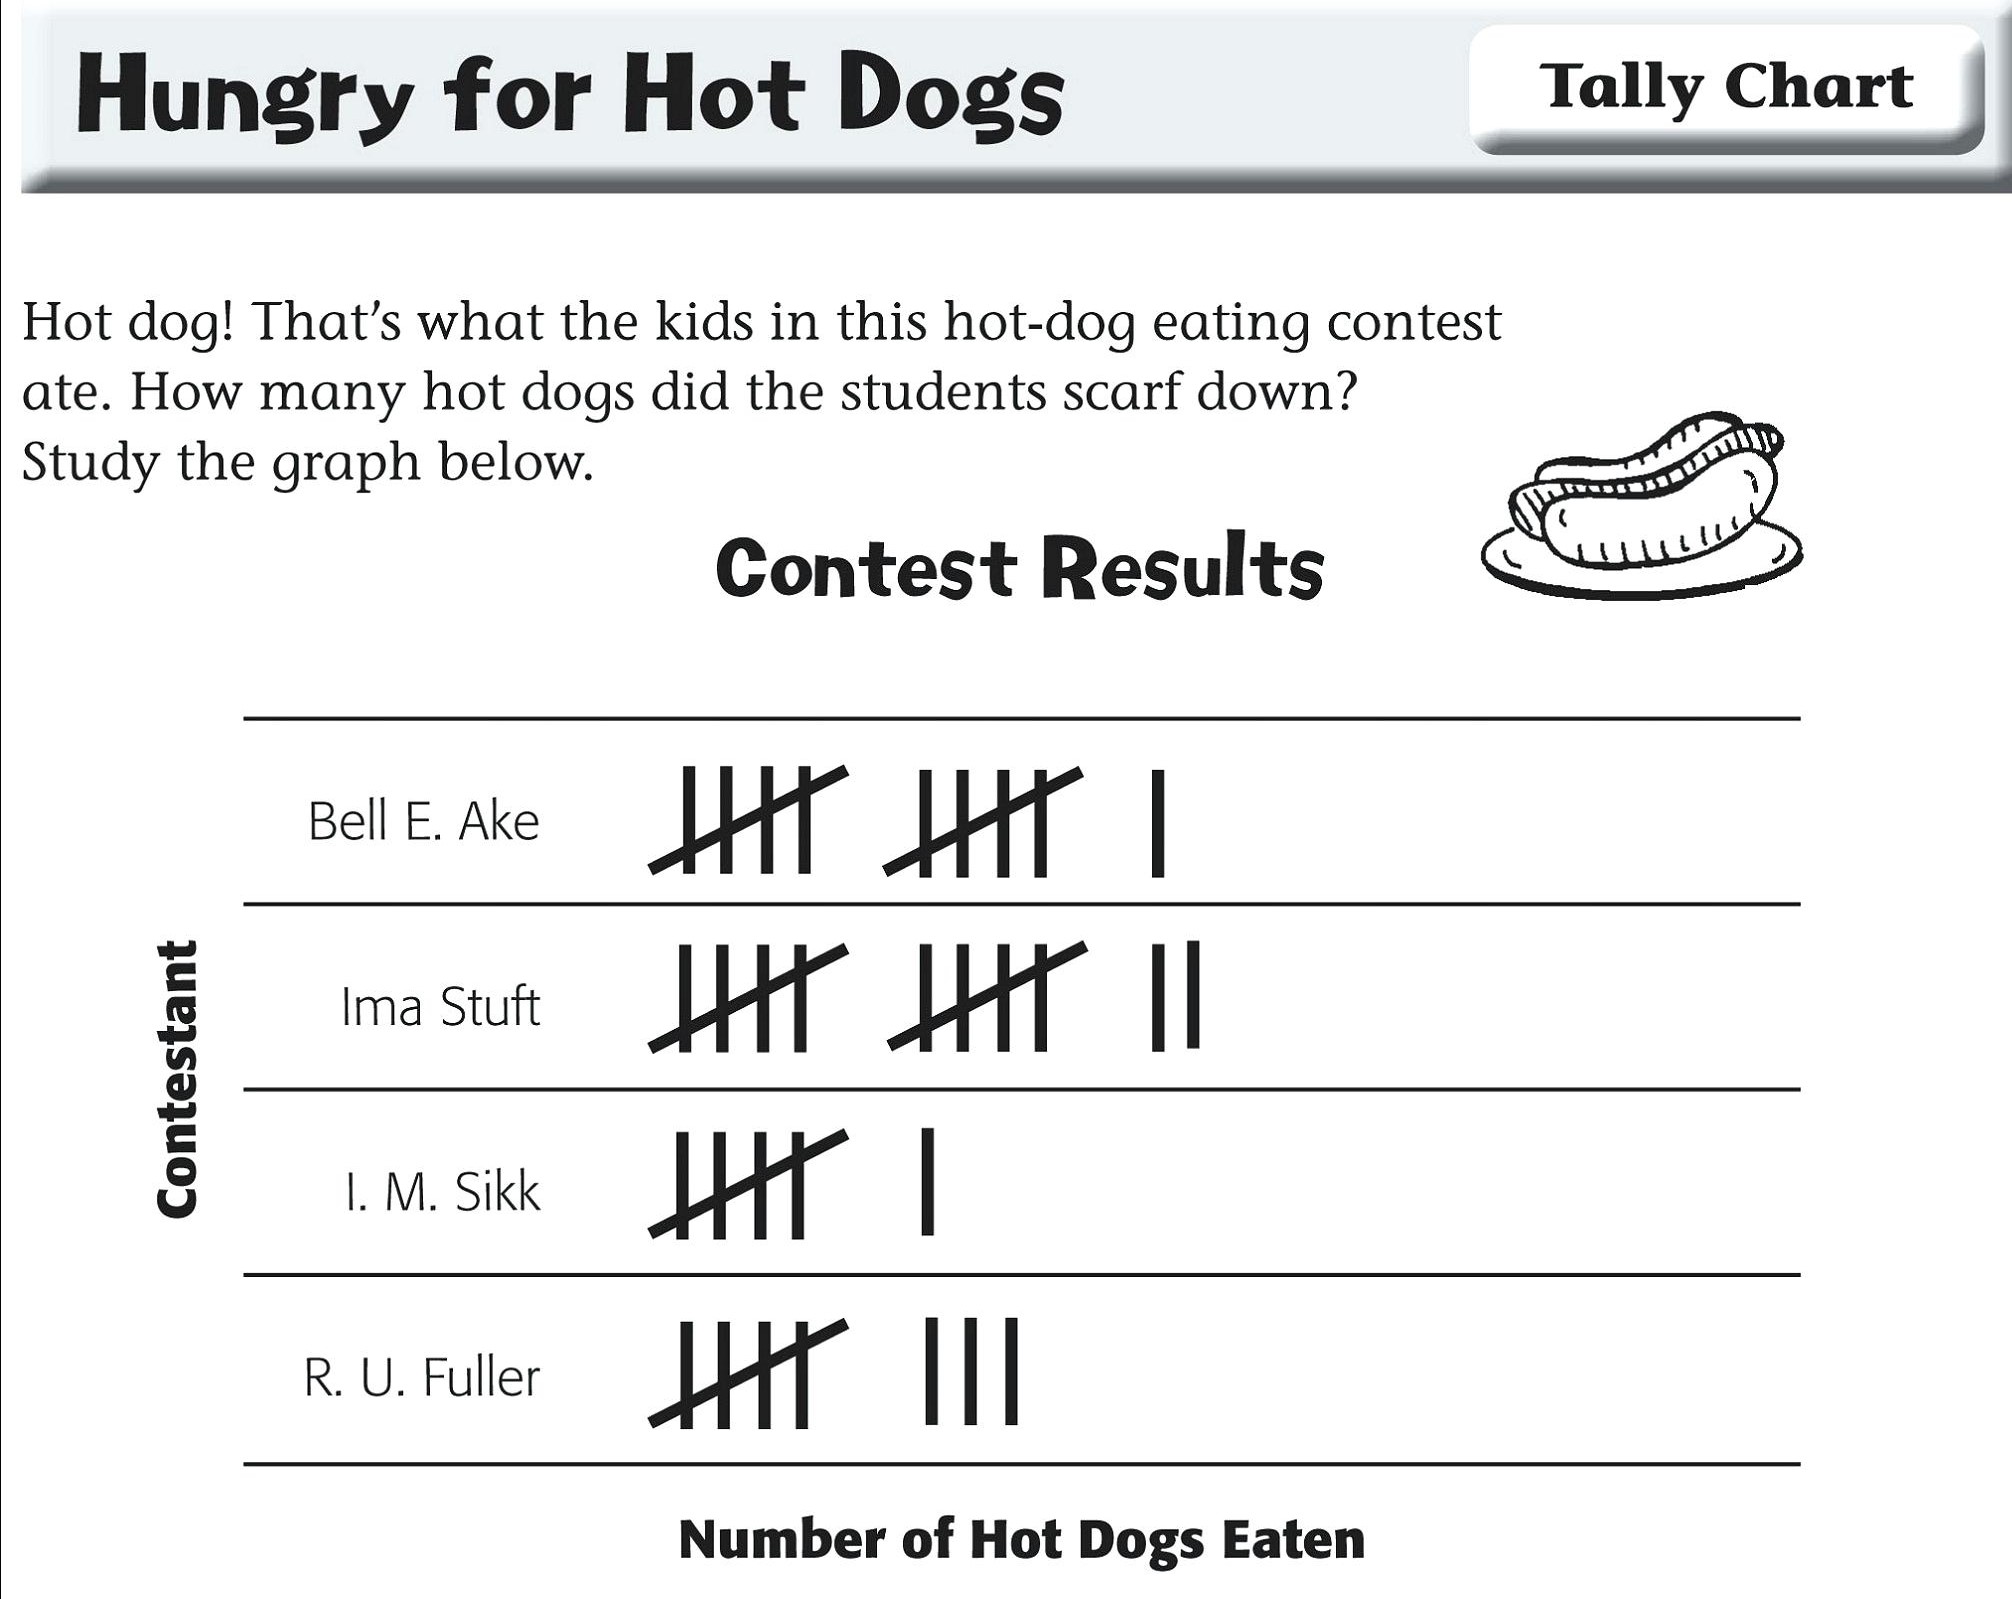
All together, how many hot dogs were eaten?
26
40
38
37


How many students like the strawberry ice cream the best?
(a)

How many children are in the class?
(a)

5 jumps
90 jumps
100 jumps
50 jumps

Moby collected seashells. How many pink AND black shells did he collect?
2 seashells
4 seashells
5 seashells
6 seashells

The tally chart shows how many times people jump roped. Who jump roped 8 times?
Moby
Becca
Tasha
Amber
Where can you find what symbols mean on a pictograph?
in the key
in the title
in the survey
in the question
In a pictograph, 1 star is equal to 2 votes. How many stars stand for 6 votes?



How many total votes were collected?
5
10
15
20

The graph shows the number of colored beads used to make a necklace. How many purple and green beads were used in all?
23
20
18
15

Find the mean of the numbers below:
4, 9, 7, 10, 5
5
6
7
8
Find the mean of the numbers below:
2, 8, 6, 3, 12, 7, 4
5
6
7
8
Find the mean of the numbers below:
3, 2, 1, 3, 2, 1, 3, 2, 1, 3, 2, 1
3
2
1
4
Find the mean of the numbers below:
1, 8, 7, 5, 6, 4, 7, 6
5
5.5
6
6.5
Find the mean of the numbers below:
20, 30, 24, 32
26.5
27.5
27
27.5
Find the mean of the numbers below:
12, 8, 14, 5, 1, 3, 0, 8, 10, 11
7.2
8
9
7.4
Find the mean of the numbers below:
1.4, 2.8, 2.4, 2.5, 2.8, 3.1, 1.1
2.3
2.2
2.4
2.1
The mean of four numbers is 10.
Three of the numbers are 9, 11 and 7.
Work out the fourth number.
9
13
11
15
Is this a statistical question: How many emails do you send each each day?
Yes
No
Is this a statistical question: How many players are on the Springfield football team?
Yes
No
Is this a statistical question: How many people in Coach Knight's classes are in the band?
Yes
No
Is this a statistical question: Do you like cinematic music?
Yes
No
The temperature in Springfield on this date in the last ten years were: 68, 68, 69, 70, 72, 70, 68, 75, 55, 67. What is the average temperature on this date over the last ten years? (Round to nearest whole number)
60
61
68
69
Jessica has five grades from assessments and quizzes. They are all weighted equally. If her grades are 50, 70, 88, 70, and 88, what is her current average grade?
71
72
73
74
2, 57, 38, 42, 6
Calculate the mean:
23, 15, 8, 12, 26, 5, 22, 9
17.1
15
13.3
12
Calculate the mean:
81, 69, 72, 80, 67, 62, 78, 74, 71, 86
82.2
92
67.2
74
Calculate the mean:
25, 36, 34, 17, 22, 31, 38
25.3
29
40
33.8
Calculate the mean:
61, 45, 52, 48, 53, 49, 57, 46, 60, 54, 58
49
53
64.7
58.3
Find the mean of the data set:
14, 19, 13, 22, 7
15
13
There is none because no numbers repeat.
15
Find the median of the data set:
17, 35, 20, 18, 29, 26
23
24.17
There is none because no numbers repeat.
18
Find the mode of the data set:
10, 18, 13, 22, 10, 13, 10, 19
14.375
13
10
12
Find the range of the data set:
37, 40, 33, 45, 32, 34
36.83
35.5
There is none because no numbers repeat.
13
What is the outlier in the following data set?
29, 2, 28, 30, 26, 31
2
29
31
23.3
Pam is 17 years old and her sister is 9. Her two brothers are 11 and 7 years old. What is the mean of their ages?
11
10
13
9
Sam had four tests last month. His scores were 81, 94, 83 and 91. What is the median of his scores?
87
87.25
83
91
When Sally went bowling, her scores were 108, 72 and 95. If she bowls a 4th game, what will her score need to be to give her an average of 91?
89
77
91
The mean of the data set is 15. What number is missing?
18, 16, _, 9, 12, 23
12
14
15
The range of a data set is 18. If the smallest number of the set is 9, what is the largest number.
27
18
13.5
Find the median of the data set:
8, 19, 14, 16, 9, 20, 9
14
12
13.57
9
The median of the data set is 18. What number is missing?
12, 17, _, 21, 13, 25
19
20
13
18
Mindy had five tests last month. Her scores were 95, 86, 78, 80 and 91. What is the range of her scores?
13
86
There is none because no numbers repeat.
The mode of a data set is 21. What number is missing?
21, 17, _, 25, 23, 13
21
Not enough information to tell
27
12
The range of a data set is 32. If the largest number in the set is 50, what is the smallest number?
18
82
Not enough information to tell
Find the mean of the data set:
15, 22, 19, 20, 29, 18, 25, 19, 31
20
19
16
22
Find the mode of the data set:
29, 22, 19, 20, 29, 23, 29, 19, 31
23
29
12
24.56
What is the outlier in the following set?
28, 31, 40, 26, 38, 65, 39, 35, 30
65
26
39
The mean of the data set is 18. What number is missing?
21, 11, _, 27, 22, 13, 16
18
Not enough information to tell
16
The median of the data set is 81. What number is missing?
82, 87, _, 77, 70, 80, 88
81
83
15
Not enough information to tell
What is the standard deviation for the data given:
5, 10, 7, 12, 0, 20, 15, 22, 8, 2
6.89
10.1
7.26
9
Set 1-Standard Deviation=3.1
Set 2-Standard Deviation=4.9
Set 3-Standard Deviation=1.7
Set 4-Standard Deviation=3.2
Which set of data probably has the points closest to the mean?
What is the standard deviation for the data given:
5, 10, 7, 12, 0, 20, 15, 22, 8, 2
6.89
10.1
7.26
9

Set 1: {10, 19, 38, 50, 51}
Set 2: {5, 21, 26, 39, 51}
Set 3: {9, 38, 50, 50, 51}
Set 4: {5, 28, 28, 28, 51}
Which data set has the largest standard deviation?
5, 10, 7, 12, 0, 20, 15, 22, 8, 2

4, 2, 7, 4, 3
{12, 13, 29, 18, 61, 35, 21}
5,11,2,12,4,2
What is the standard deviation for the data given:
5, 10, 7, 12, 0, 20, 15, 22, 8, 2
6.89
10.1
7.26
9
What is the standard deviation for the data given:
5, 10, 7, 12, 0, 20, 15, 22, 8, 2
6.89
10.1
7.26
9
{12, 13, 29, 18, 61, 35, 21}
5,11,2,12,4,2
Set 1-Standard Deviation=3.1
Set 2-Standard Deviation=4.9
Set 3-Standard Deviation=1.7
Set 4-Standard Deviation=3.2
Which set of data probably has the points closest to the mean?
Set 1: {10, 19, 38, 50, 51}
Set 2: {5, 21, 26, 39, 51}
Set 3: {9, 38, 50, 50, 51}
Set 4: {5, 28, 28, 28, 51}
Which data set has the largest standard deviation?
All of the below sets have the same mean.
Set 1 - Standard Deviation = 3.1
Set 2 - Standard Deviation = 4.9
Set 3 - Standard Deviation = 1.7
Set 4 - Standard Deviation = 3.2
Which set of data probably has the points closest to the mean?
Set 1
Set 2
Set 3
Set 4

Which dotplot has the smallest standard deviation?
Dotplot A
Dotplot B
Dotplot C
Dotplot D
The _______________________ is the number that occurs most often in a data set.
Mean
Median
Mode
IQR
When there is an outlier, the _____________________________ is the better measure of center.
Mean
Median
Mode
MAD
The _______________________ is what you get when you subtract the lowest value from the highest.
Range
IQR
Q3
Q1
When the distribution of data makes a bell-shaped curve, this is called a _____________________________ distribution.
Symmetric
Bimodal
Skewed Right
Skewed Left
An ______________________ is a single piece of data that falls well outside the range of the other values.
Outlier
Outlander
Timbaland
Range

Describe the shape of the histogram’s distribution.
Skewed Left
Skewed Right
Symmetric
BiModal

Approximately, what percentage of Class 1 had a grade over 90?
50%
25%
100%
75%

Approximately, what percentage of class 2 had a grade over 70?
75%
25%
50%
100%

Which group might have an outlier? _________
Class 1
Class 2
Both
None

Describe the shape of the distribution.
Symmetric
BiModal
Unimodal
Skewed Left

A
B
C
D

A
B
C
D

A
B
C
D

A
B
C
D

A
B
C
D

A
B
C
D

A
B
C
D

A
B
C
D

A
B
C
D

A
B
C
D

A
B
C
D

A
B
C
D


The scatter plot below shows the number of books read by students in Mrs. Hall’s English class and their final grades. Which statement represents the best description about the line of best fit?
The more books students read, the lower their English grade.
The more books students read, the higher their English grade.
The fewer books students read, the higher their English grade.
No relationship exists between the number of books students read and their English grades.

What type of correlation best describes the scatter plot shown?
positive, weak
positive, strong
negative, weak
no correlation
Data is collected comparing sales of cars and the age of the salesperson. After analyzing the data, it is determined that the correlation coefficient is 0.19. What does this mean?
There is no correlation between sales and age.
There is a strong positive correlation between sales and age.
There is a strong negative correlation between sales and age.
There is a weak negative correlation between sales and age.

Estimate the correlation coefficient for this scatterplot.
r = 1.2
r = 0.89
r = 0
r = -0.89

Which with is the line of best fit?
A) Black
B) Orange
C) Red
D) Blue
Rich is a member of a gym. He pays a monthly fee plus a per-visit fee. The equation below represents the monthly amount Rich pays for his membership to the gym per month for x visits.
y= 10 + 3x
What does the y-intercept of the graph of this equation represent?
The monthly fee
How much Rich pays per visit
The number of times Rich goes to the gym
The total cost at the end of the month


Car weight and distance traveled using a full tank of gas. r=−.86
strong positive
strong negative
weak positive
weak negative

1.Use linear regression to formulate an equation that can be used to model the relationship between the runner's distance and the time in minutes based on the information provided on the table.
y=7.699x−0.211
y=0.129x+0.046
y=0.997x
y=0.080x+0.400

2.Use the equation or the graph that you created. What is the best prediction of the runner's distance if he runs for a total of 60 minutes?
(a) miles
2.6
5.2
10.3

3.What is the correlation coefficient (rounded to the nearest thousandth)?
(a)
Does this situation represent association only, causation or neither? (b)
.129
.046
-.994

4.What does the correlation coefficient reveal about the strength of the linear association between the runner's distance and the duration of his run?
(a) correlation
5.What does each correlation coefficient say about the relationship between x and y?
Strong positive
r = 0.78
Weak positive
r = 0.23
r = -0.89
Weak negative
r = -0.14
Moderate positive
r = 0.50
6.
A perfect negative correlation has a correlation coefficient of (a) .
A perfect positive correlation has a correlation coefficient of (b) .
A scatterplot with No correlation has a correlation coefficient of (c) .

7.Estimate the correlation coefficient
(a)
Interpret the strength of the relationship. (b)
r = 1
r = -1
r ≈ 0.8
r ≈ -0.5
8.Data is analyzed comparing hours studied and grades. It is determined that the correlation coefficient is 0.92. What does this mean?
There is a strong positive correlation between studying and grades.
There is a strong negative correlation between studying and grades.
There is a weak positive correlation between studying and grades.
There is a weak negative correlation between studying and grades.

9.Based on the scatter plot, which statement best describes the trend?
As the daily temperature increases, the number of beach visitors increases.
As the daily temperature decreases, the number of beach visitors increases.
As the daily temperature increases, there is no change in the number of beach visitors
As the daily temperature increases, the number of beach visitors decreases

10.What is the correlation coefficient, and what does it say about the line?
-.99 weak negative relationship
-.99 strong negative relationship
.99 strong positive relationship
.99 weak positive relationship

11. Look at the two scatterplots. After using linear regression, a line of best fit has been calculated. Which plot do you believe has the higher correlation coefficient? (a)
Explain your reasoning. (b)
1.Use linear regression to formulate an equation that can be used to model the relationship between the runner's distance and the time in minutes based on the information provided on the table.
y=7.699x−0.211
y=0.129x+0.046
y=0.997x
y=0.080x+0.400
2.Use the equation or the graph that you created. What is the best prediction of the runner's distance if he runs for a total of 60 minutes?
(a) miles
2.6
5.2
10.3
3.What is the correlation coefficient (rounded to the nearest thousandth)?
(a)
Does this situation represent association only, causation or neither? (b)
.129
.046
-.994
4.What does the correlation coefficient reveal about the strength of the linear association between the runner's distance and the duration of his run?
(a) correlation
5.What does each correlation coefficient say about the relationship between x and y?
Strong positive
r = 0.78
Weak positive
r = 0.23
r = -0.89
Weak negative
r = -0.14
Moderate positive
r = 0.50
6.
A perfect negative correlation has a correlation coefficient of (a) .
A perfect positive correlation has a correlation coefficient of (b) .
A scatterplot with No correlation has a correlation coefficient of (c) .
7.Estimate the correlation coefficient
(a)
Interpret the strength of the relationship. (b)
r = 1
r = -1
r ≈ 0.8
r ≈ -0.5
8.Data is analyzed comparing hours studied and grades. It is determined that the correlation coefficient is 0.92. What does this mean?
There is a strong positive correlation between studying and grades.
There is a strong negative correlation between studying and grades.
There is a weak positive correlation between studying and grades.
There is a weak negative correlation between studying and grades.
9.Based on the scatter plot, which statement best describes the trend?
As the daily temperature increases, the number of beach visitors increases.
As the daily temperature decreases, the number of beach visitors increases.
As the daily temperature increases, there is no change in the number of beach visitors
As the daily temperature increases, the number of beach visitors decreases
10.What is the correlation coefficient, and what does it say about the line?
-.99 weak negative relationship
-.99 strong negative relationship
.99 strong positive relationship
.99 weak positive relationship
11. Look at the two scatterplots. After using linear regression, a line of best fit has been calculated. Which plot do you believe has the higher correlation coefficient? (a)
Explain your reasoning. (b)

Determine the correlation of the points on the scatterplot.
Positive Correlation
Negative Correlation
No Correlation
Zero Correlation

Determine the correlation of the points on the scatterplot.
Positive Correlation
Negative Correlation
No Correlation
Zero Correlation

Determine the correlation of the points on the scatterplot.
Positive Correlation
Negative Correlation
No Correlation
Zero Correlation

The table shows the lengths and corresponding ideal weights of sand sharks. Which r-value is more accurate for the data?
r = 0.99
r = -0.90
r = 0.09
r = -0.099

Does the following scatterplot represent a function? Why or why not?

The table shows the attendance at a flag football game for the first 8 games of the season. What is the correlation of the data?
Strong Positive
Strong negative
Weak Postive
Weak Negative
No correlation

Determine the line of best fit for the data shown.
y = −10.63x−3.80
y=3.88x−10.63
y=3.87x+0.90
y=3.88x−11
If the correlation coefficient, r, of a data set is r = 0. 32. What type of correlation does the data have?
Strong Positive
Strong negative
Weak Postive
Weak Negative
No correlation

The table below gives the height and the shoe sizes of six male students. Predict the height of a student that has a shoes size of 10.
-40.23
-15.60
0.42
-15.39

The table gives the number of hours spent studying for an algebra exam (x) and the final exam (y). Determine the correlation of the data.
Weak positive
Weak Negative
Strong Positive
Strong Negative

A student who waits on tables at a restaurant recorded the cost of meals and the tip left by single diners. If the next diner orders a mean costing $14.50 , how much tip should the waiter wait to receive.
$0.75
$1.01
$2.25
$1.98
If the correlation coefficient, r, of a data set is r = -0.95. What type of correlation does the data have?
Strong Positive
Strong negative
Weak Postive
Weak Negative
No correlation

Estimate the correlation coefficient for this scatterplot.
A) r = -0.9
B) r = 1
C) r = 0.9
D) r = -1
Which graph depicts the strongest positive correlation?


Is this line an accurate line estimate of best fit for the data?
Yes
No
If the correlation coefficient, r, of a data set is r = -0.95. What type of correlation does the data have?
Strong Positive
Strong negative
Weak Postive
Weak Negative
No correlation
If the correlation coefficient, r, of a data set is r = 0. 32. What type of correlation does the data have?
Strong Positive
Strong negative
Weak Postive
Weak Negative
No correlation
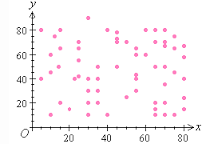
What type of correlation does this graph show?
A) Positive
B) negative
C) none
D) all of the above
Estimate the correlation coefficient
r = 1
r = -1
r ≈ -0.8
r ≈ 0.8
r ≈ -0.5
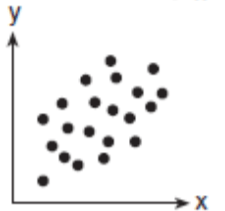
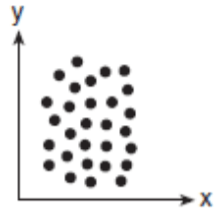
Which scatter plot diagram shows the strongest positive correlation?
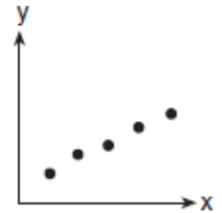
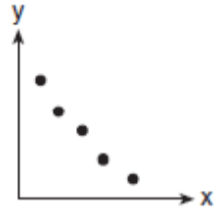
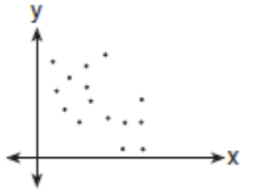
Which graph represents data that has a correlation coefficient close to -1?
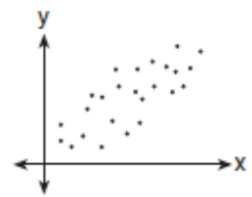
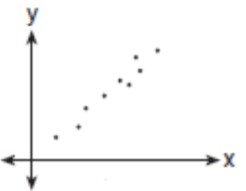
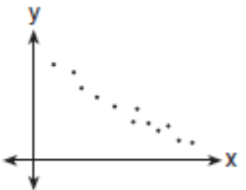
Which scatter plot would use y=21x+2 as line of best fit?


What is the equation of the line of best fit?
y= −21x + 6
y= 21x +6
y= 6x + 2
y = -2x +6
The linear model to represent the distance (in miles) traveled given the time (in hours) driving is
m=−1.79+61.93h . Predict how far a person will travel driving 10 hours.617.51 miles
621.09 miles
100 miles
0.19 miles

Which of the following best describes the correlation shown on the graph?
negative correlation
positive correlation
no correlation

Which of the following best describes the correlation shown on the graph?
negative correlation
positive correlation
no correlation

Which of the following best describes the correlation shown on the graph?
negative correlation
positive correlation
no correlation

Which of the following best describes the correlation shown on the graph?
negative correlation
positive correlation
no correlation

Which of the following best describes the correlation shown on the graph?
negative correlation
positive correlation
no correlation

Which of the following best describes the correlation shown on the graph?
negative correlation
positive correlation
no correlation

Which of the following best describes the correlation shown on the graph?
negative correlation
positive correlation
no correlation

Which of the following best describes the correlation shown on the graph?
negative correlation
positive correlation
no correlation
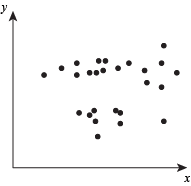
Which of the following best describes the correlation shown on the graph?
negative correlation
positive correlation
no correlation

Which of the following best describes the correlation shown on the graph?
negative correlation
positive correlation
no correlation

Which correlation coefficient (r) best represents the graph?
r = -1
r = 0
r = 1.4
r = 1

Which correlation coefficient (r) best represents the graph?
r = -0.95
r = 0
r = -1.4
r = 1

Which correlation coefficient (r) best represents the graph?
r = -0.95
r = 0
r = 2
r = 1
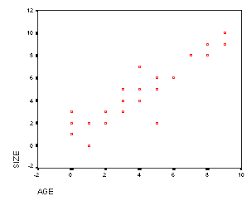
Which correlation coefficient (r) best represents the graph?
r = -0.95
r = 0
r = 0.85
r = 1.1
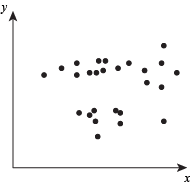
Which correlation coefficient (r) best represents the graph?
r = -0.95
r = 0
r = 0.85
r = 1.1
The numbers of games won by 12 teams in the national league is below:
11, 5, 6, 6, 9, 10, 19, 14, 11, 9, 9, and 6
Are there any outliers?
Yes, 5 is an outlier
Yes, 19 is an outlier
Yes, 5 and 19 are outliers
No
17, 18, 18, 19, 20, 21, 21, 23, 25




About 50 % of the data values are greater than...
12
15
22
31
Given the information below, determine which of the answer choices would be considered an outlier.
Q1: 15
Median: 27
Q3: 35
3
82
63
all of the above
Given the information below, determine which of the answer choices would be considered an outlier.
Q1: 48
Median: 65
Q3: 90
5
63
149
none of the above
Which box plot represents the data set below?
22, 34, 25, 32, 41, 21, 23, 36, 37, 30, 38, 44, 32, 45




How do you calculate the IQR (interquartile range) ?
Q2 - Q1
Q1 - Q3
Q3 - Q2
Q3 - Q1

What is the interquartile range of these scores?
50
70
40
30
Minimum: 1
Q1: 3
Median: 5
Q3: 7
Maximum: 9

What is the range of homework assignments for class 2?
(a)
What is the IQR for class 1?
(a)

What do points B and D represent on the box plot?
Mean and Mode
Mean and Median
Least and Greatest Value
First and Third Quartiles


What amount of cupcakes makes up the middle 50% of the data?
16-22 cupcakes
12-32 cupcakes
22-28 cupcakes
16-28 cupcakes
What is the third quartile of the data?

Based on the box plot, which of the following is not true?
Which two values would give this data set a mean of 86, a median of 84, and a range of 18?
80, 82, ___, 86, ___
(enter them least to greatest)
(a)
Matthew conducts a survey for which he collects people’s ages. The results of Matthew’s survey are shown.
• Group 1: 40 30 20 35
• Group 2: 24 32 26 45
• Group 3: 20 36 36 30 36
Order the groups based on their mean.
Group 1
Group 3
Group 2
Three values are missing from the data set. Given that the mode is 44, the mean is 58, the range is 44, and the data is in ascending order, find the missing values.
You want to retake two quizzes out of the five you have taken this semester.
Your scores on the other three were 86, 92, and 95. You want the mean to be 93. The range ends up being 12. What are possible scores to satisfy these conditions?
94, 98
92, 100
90, 98
94, 96

