
NEW
Font size
 Worksheets
Stem and Leaf
Total questions: 25
Worksheet time: 25mins

This stem and leaf diagram shows the ages of a group of people.How many people are there in the group?
12
10
16
11
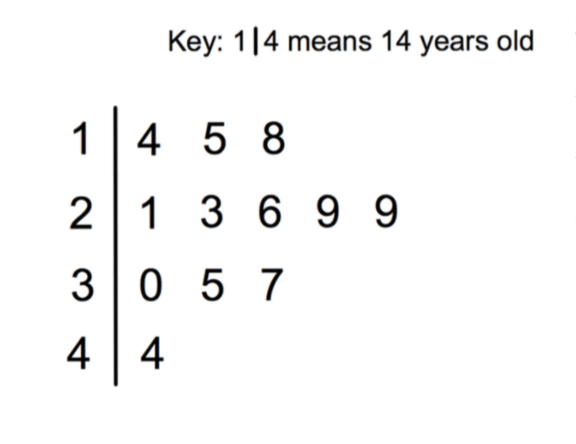
This stem and leaf diagram shows the ages of a group of people. How old is the youngest member of this group?
14
10
15
1

This stem and leaf diagram shows the ages of a group of people. How old is the oldest member of this group?
44
40
50
4

This stem and leaf diagram shows the ages of a group of people. How many people in this group are younger than 20?
3
8
4
5

This stem and leaf diagram shows the ages of a group of people. How many people in this group are older than 25?
7
4
8
5

This stem and leaf diagram shows the heights of Mrs Smith's flowers. How many flowers does she have?
19
20
6
18

This stem and leaf diagram shows the heights of Mrs Smith's flowers. What is the height of the shortest flower?
9cm
1cm
12cm
0.9cm

This stem and leaf diagram shows the heights of Mrs Smith's flowers. What is the height of the tallest flower?
5cm
5.3cm
53cm
50cm

This stem and leaf diagram shows the heights of Mrs Smith's flowers. How many flowers have a height of 14cm?
3
1
0
2

This stem and leaf diagram shows the heights of Mrs Smith's flowers. How many flowers are taller than 40cm?
5
2
7
6

This stem and leaf diagram shows the heights of Mrs Smith's flowers. What fraction of the flowers are shorter than 20cm?
7/19
9/20
7/20
6/19

This stem and leaf diagram shows the marks achieved by students in Mrs Turner's class. How many boys are in the class?
11
5
12
16

This stem and leaf diagram shows the marks achieved by students in Mrs Turner's class. How many girls are there in the class?
11
5
22
16

This stem and leaf diagram shows the marks achieved by students in Mrs Turner's class. What was the highest mark in the class?
47
109
45
29

This stem and leaf diagram shows the marks achieved by students in Mrs Turner's class. How many students got more than 24 marks?
14
16
15
12
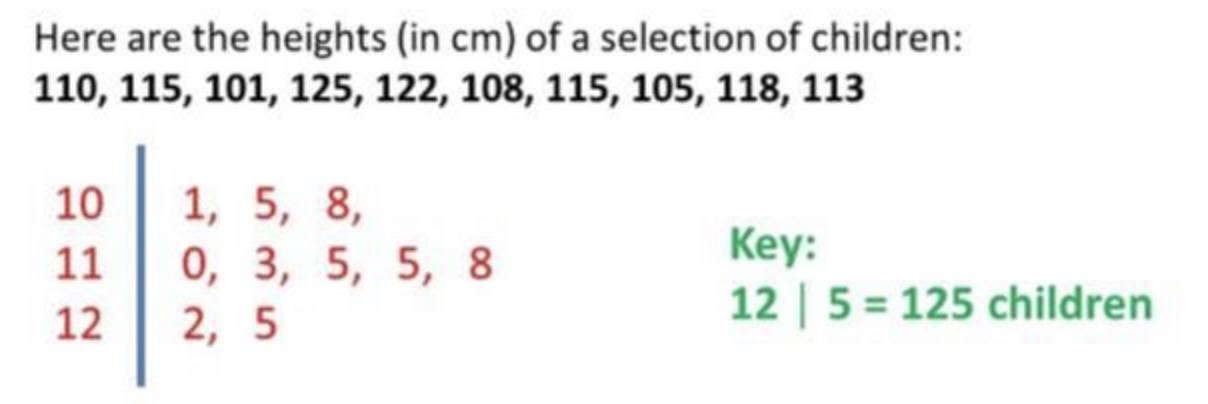
What mistake has been made when making this stem and leaf diagram? In the next question, you will be asked to explain this choice.
The stem should only have one number in it.
The key is incorrect.
There is a number missing.
There are no mistakes - the stem and leaf diagram is correct.

What is the Maximum data item on this stem and leaf plot?
56%
88%
94%
8122348%

What is the Mode of this data?
96
97
68
802

What is the Minimum data item?
0
71
5
23

What is the Mode of this data?
74
56888
68
45



