wayground logo

Free Printable Worksheets

Font size

S
M
L
XL
Worksheets

MATH-PICTOGRAPH

Total questions: 68

Worksheet time: 54mins
Name
Class
Date
1.

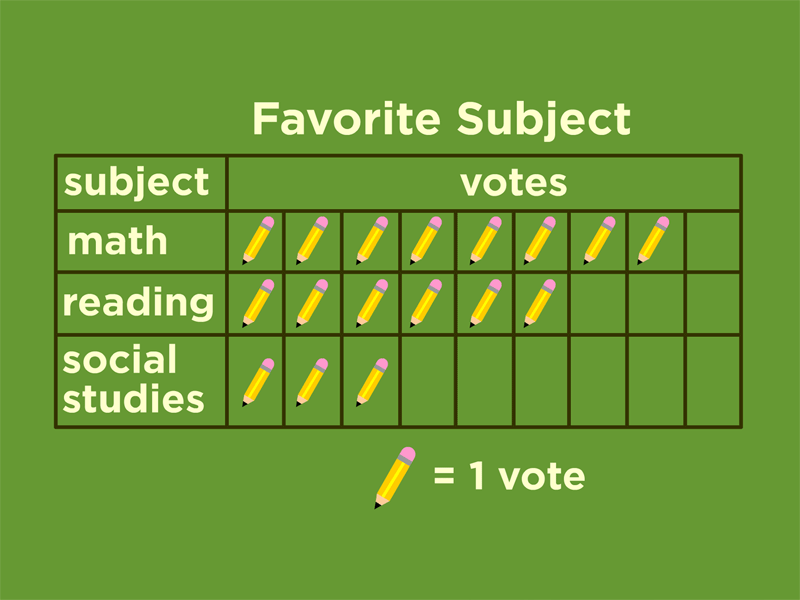
How many votes did reading receive?

a)

2

b)

4

c)

6

d)

8

2.

How many more kids liked strawberry ice cream, than chocolate ice cream?

a)

2

b)

3

c)

1

3.

how many students are in this class? 6+3+4=6+3+4=  

(a)  

4.

What is the most popular fruit?

a)

bananas

b)

apples

c)

oranges

5.

Which fruit was chosen by the fewest children?

a)

banana

b)

pear

c)

strawberry

d)

apple

6.

What is the title of this graph?

a)

Our Shoe Graph

b)

Favorite Cookie

c)

My Favorite Color

7.

How many students liked Milk and Hot Cocoa? (Count them all together)

a)

10

b)

12

c)

9

8.
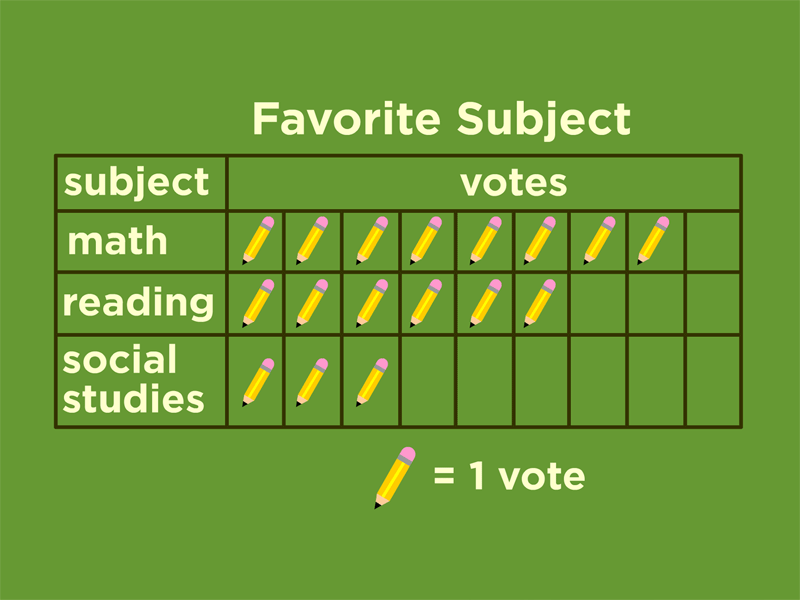
Which subject received the most votes?
a)
science
b)
reading
c)
social studies
d)
math
9.

How many children ordered nuggets?

(a)  

10.

How many bottles did Sarah collect?

(a)  

11.

What kind of graph is this?

a)

Tally Chart

b)

Bar Graph

c)

Pictograph

12.

How many students like pears and bananas?

a)

13

b)

14

c)

12

d)

10

13.

Which fruit did they like the least?

a)

apple

b)

banana

c)

grape

d)

pear

14.

How many people ate lemon?

a)

7

b)

0

c)

4

d)

1

15.

How many cows are in the chart?

a)

3

b)

8

c)

5

d)

2

16.

Which fruit has the most vote?

a)

apple

b)

pear

c)

grape

d)

banana

17.

How many voted for pear and grapes?

a)

eight

b)

nine

c)

twenty-five

d)

nineteen

18.

What subject has the greatest number of votes?

a)

Reading

b)

Social Studies

c)

Math

19.
What type of graph is this?
a)
Bar Graph
b)
Pictograph
c)
Line Plot
d)
Tally Chart
20.

Moby collected seashells. How many pink AND black shells did he collect?

a)

2 seashells

b)

4 seashells

c)

5 seashells

d)

6 seashells

21.
What type of graph is this?
a)
bar graph
b)
pictograph
c)
tally chart
22.
Which pet got the most votes?
a)
cats
b)
dogs
c)
fish
23.
How many people like fish best?
a)
10
b)
4
c)
6
d)
5
24.
How many people like dogs best?
a)
10
b)
4
c)
6
d)
5
25.
Which fruit did most children choose?
a)
apple
b)
banana
c)
grapes
26.
How do you group tally marks together?
a)
by ones
b)
by twos
c)
by threes
d)
by fives
27.
How many fewer children chose science than math?
a)
2 children
b)
4 children
c)
5 children
28.
Use the picture to answer the following question.
Which subject did the most children choose?
a)
Math
b)
Reading
c)
Science
29.
How many more children chose math than reading?
a)
5 children
b)
2 children 
c)
4 children
30.
How many more children chose math than reading?
a)
5 children
b)
2 children 
c)
4 children
31.
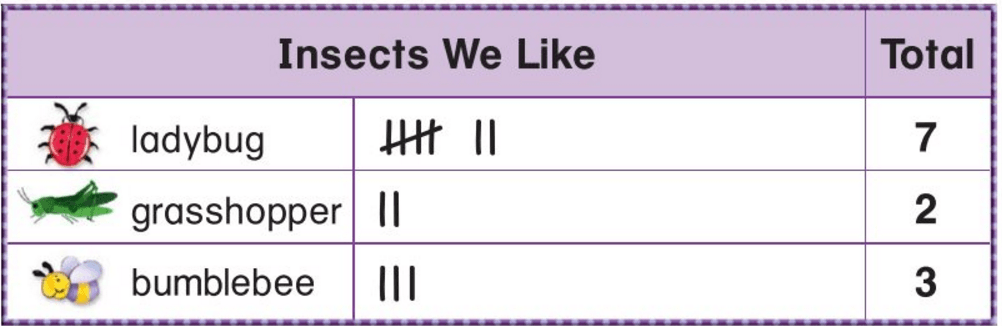
How many more people chose ladybug than bumblebee?
a)
3
b)
5
c)
4
32.
How many fewer people chose grasshopper than bumblebee?
a)
1
b)
2
c)
3
33.
Katie asked her friends their favorite food. Select the number of tally marks for Hot Dog.
a)
3
b)
4
c)
5
d)
6
34.
Choose the sentence that describes the data in the tally chart.
a)
Pizza had 10 votes.
b)
Pizza got the most votes
35.
Which pet got the most votes?
a)
cats
b)
dogs
c)
fish
36.
How many people like fish best?
a)
10
b)
4
c)
6
d)
5
37.
How many people like dogs best?
a)
10
b)
4
c)
6
d)
5
38.
Which fruit did most children choose?
a)
apple
b)
banana
c)
grapes
39.
How do you group tally marks together?
a)
by ones
b)
by twos
c)
by threes
d)
by fives
40.
How many fewer children chose science than math?
a)
2 children
b)
4 children
c)
5 children
41.
Use the picture to answer the following question.
Which subject did the most children choose?
a)
Math
b)
Reading
c)
Science
42.
How many more children chose math than reading?
a)
5 children
b)
2 children 
c)
4 children
43.
How many more children chose math than reading?
a)
5 children
b)
2 children 
c)
4 children
44.
How many more people chose ladybug than bumblebee?
a)
3
b)
5
c)
4
45.
How many fewer people chose grasshopper than bumblebee?
a)
1
b)
2
c)
3
46.
Katie asked her friends their favorite food. Select the number of tally marks for Hot Dog.
a)
3
b)
4
c)
5
d)
6
47.
Choose the sentence that describes the data in the tally chart.
a)
Pizza had 10 votes.
b)
Pizza got the most votes
48.
How many tally marks?
a)
10
b)
15
c)
3
d)
13
49.
How many tally marks?
a)
9
b)
6
c)
3
d)
7
50.
What type of graph is this?
a)
bar graph
b)
pictograph
c)
tally chart
51.
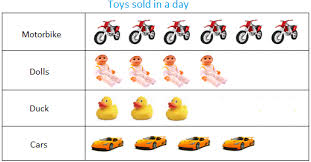
Which toy was sold the most?
a)
motorbikes
b)
dolls
c)
ducks
d)
cars
52.

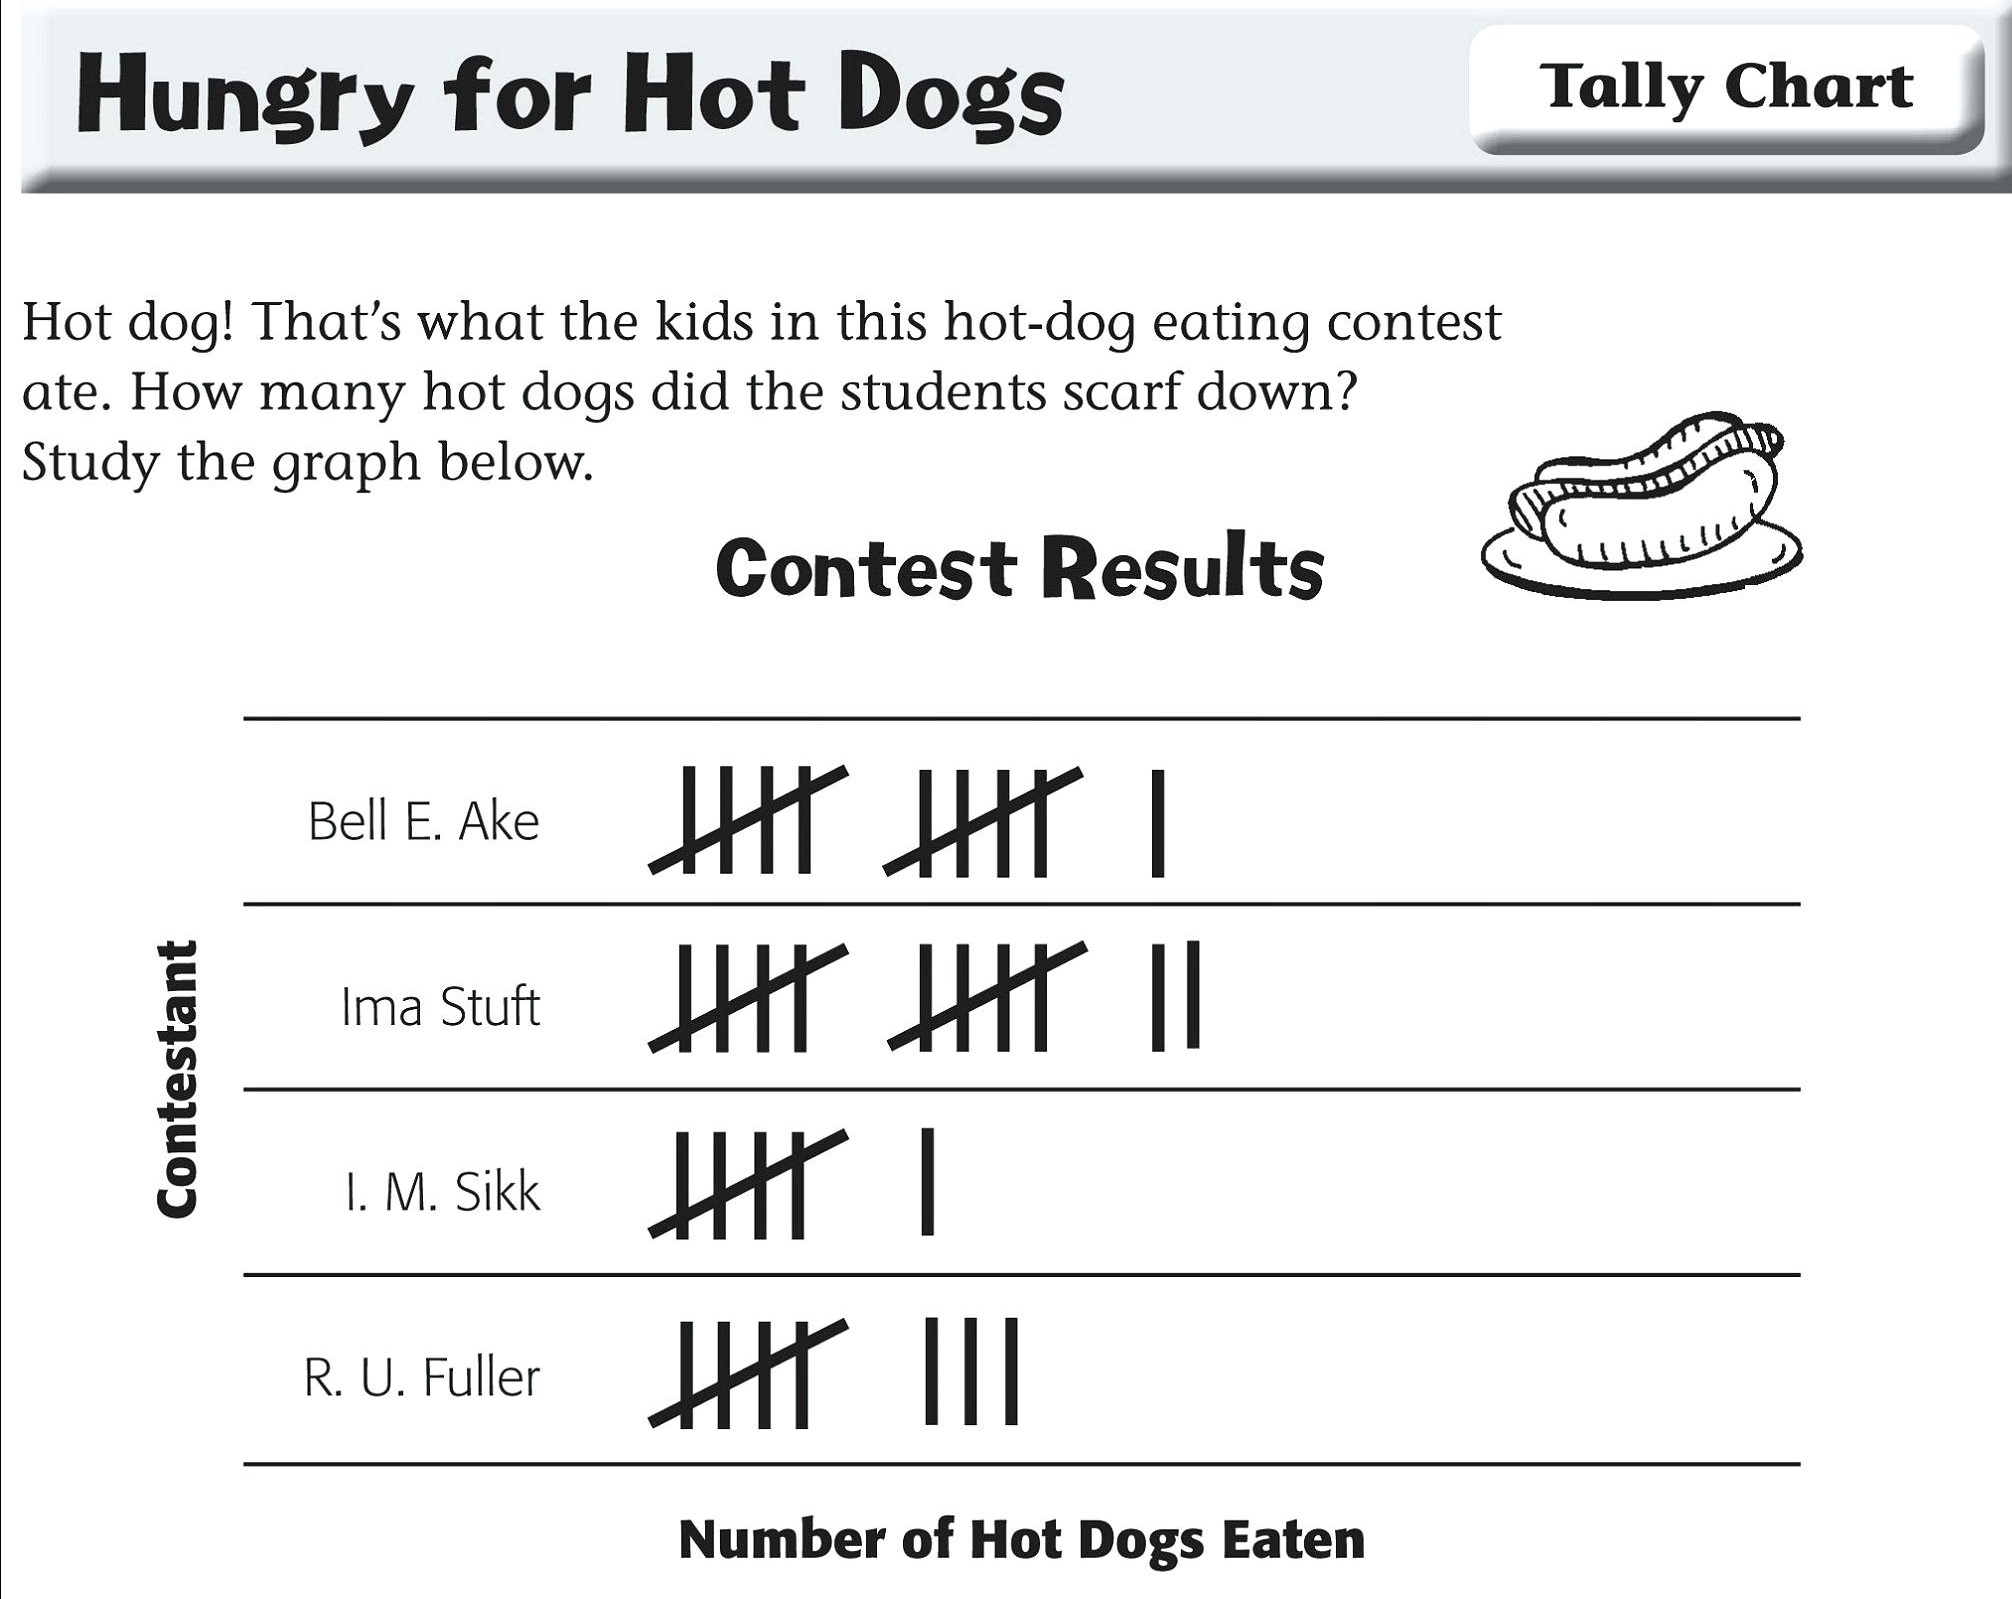
How many hot dogs did Bell E. Ake eat?

a)

11

b)

9

c)

2 1/2

d)

12

53.

How many more did Ima Stuft eat than R.U. Fuller?

a)

1

b)

4

c)

20

d)

3

54.

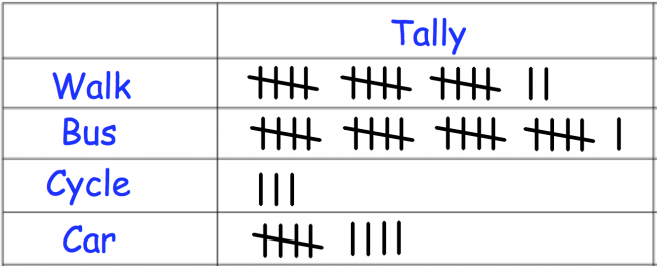
How many people cycle to school?

a)

3

b)

15

c)

4

d)

2

55.

What kind of graph is this?

a)

pictograph

b)

tally graph

c)

bar graph

d)

it is not a graph

56.

How many eggs were pink?

a)

5

b)

10

c)

12

d)

9

57.

How many students scored a 90?

a)

3

b)

7

c)

4

58.

How many more students voted for math than reading?

a)

8

b)

6

c)

3

d)

2

59.

How many chose mushroom pizza?

a)

20

b)

4

c)

8

60.

What kind of graph is this?

a)

bar graph

b)

pictograph

c)

tally graph

61.

What type of graph is this?

a)

Pictograph

b)

Bar Graph

c)

Tally Graph

62.

How many liked cat?

a)

2

b)

5

c)

100

d)

10

63.

Which graph has a key?

a)
b)
c)
64.

Which drink got the most votes?

a)

Milk

b)

Apple Juice

c)

Coke

d)

Pepsi

65.

How many more liked triceratops than stegosaurus?

a)

4

b)

5

c)

1

66.

How many liked T-rex or stegosaurus?

a)

8

b)

7

c)

6

67.

How many liked grapes and bananas?

a)

6

b)

2

c)

8

d)

10

68.

How many more Tulips are there than roses in the garden?

a)

3

b)

6

c)

10

d)

9