
 Worksheets
Forces and motion recap
Total questions: 168
Worksheet time: 9hrs 2mins


An object's inertia is effected by its mass.


The momentum of an object depends upon the object's ___________&_____________.
size and shape
mass and speed
mass and veloctiy
mass and energy


Which of these is NOT a unit of distance?
metres
kilometres
millimetres
seconds
Which of these is NOT a unit of time?
hours
minutes
seconds
metres
Which of these is NOT a unit of speed?
m/s
km/h
kg
mm/day
To convert from minutes to hours...
minutes × 60 = hours
minutes ÷ 60 = hours
minutes ÷ 100 = hours
minutes x 100 = hours
To convert from centimetres to metres...
cm × 100 = metres
cm ÷ 100 = metres
cm × 1000 = metres
cm ÷ 1000 = metres
The equation for calculating speed is...
speed = timedistance
speed = distancetime
speed = distance × time
speed = time × distance
A fox runs 120 metres in 8 seconds. Calculate the speed of the fox.
960 m
15 m/s
128 seconds
0.0667 m/s
A boat sails 200 km in 8 hours. What is its speed?
0.04 km/h
1600 km/h
25 km/h
208 km/h
A snail travels 50 cm in 30 minutes. What is its speed in m/h (metres per hour)
1.67 m/h
1 m/h
1500 m/h
0.6 m/h
Which of these objects will travel the furthest in 1 minute?
A car driving at 30 m/s
A train travelling at 1500 m/min
A motorbike travelling at 120 km/h
A boat travelling at 1 km/min
How far will a person go if they jog for 2 hours at a speed of 12 km/h?
Arnold drives 120 km in his car at a speed of 60 km/h. How long did the journey take?
180 hours
60 hours
3 hours
2 hours
Ellie drove her car at a constant speed of 70 km/h. If she drives for 120 minutes, how many km has she driven?
600 km
2.4 km
140 km
1.71 km
Maggie lives 15 km away from her friend. If she walks at a constant speed of 5 km/h, how long will it take her to get to her friend's house?
2 hours
3 hours
2.5 hours
3 km/hour
A car travelled a distance of 280 km in 4 hours. What was the speed of the car?
280 km/h
112 km/h
70 km/h
7 km/h
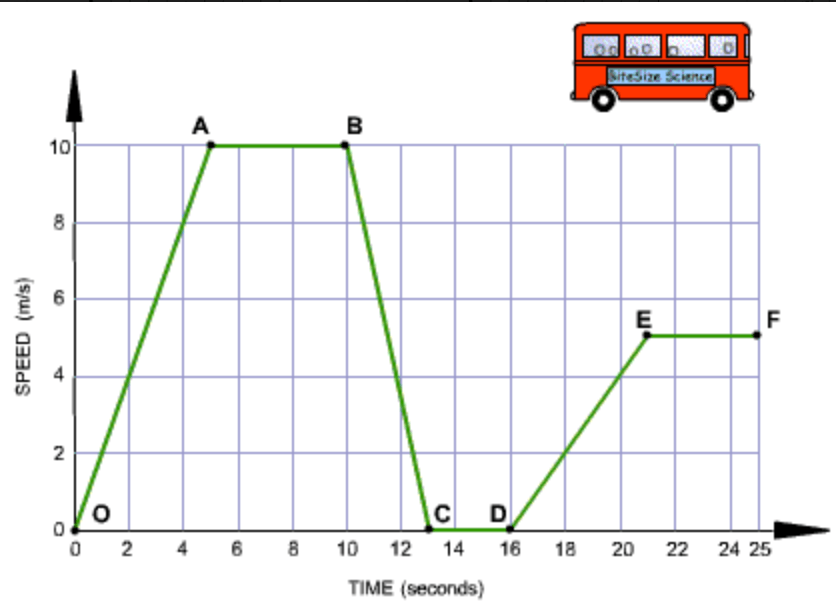
How many times did the bust come to a stop?
1
5
2
3

What is the graph showing?
Speeding up moving away from start
Speeding up moving towards start
Slowing down moving towards start
Slowing down moving away from start

What is the graph showing?
Constant high speed
Stopped
Accelerating
Constant low speed

What is this graph showing?
Constant speed
Gradually speeding up
Gradually slowing down
At rest
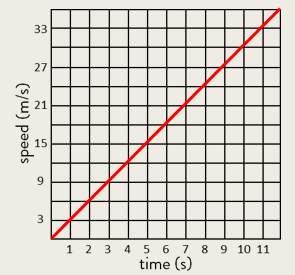
Accelerating gradually
Stopping
Slowing down constantly
Speeding up constantly

What is this graph showing?
Fast constant speed
Slow constant speed
At rest
Accelerating

What is this graph showing?
Two objects speeding up constantly
Two objects slowing down constantly
Two objects accelerating
Two objects at rest

What is the graph showing?
Slowing down moving toward start
Speeding up moving toward start
Slowing down moving away from start
Speed up moving away from start

What is the graph showing?
Constant speed towards start
Constant speed away from start
Acceleration away from start
Acceleration towards start
What does the slope of a distance-time graph represent?
Speed
Acceleration
Distance
Time
If a distance-time graph is a horizontal line, what does this indicate about the object's motion?
The object is moving at a constant speed
The object is accelerating
The object is stationary
The object is moving backwards
On a speed-time graph, what does the area under the curve represent?
Distance traveled
Acceleration
Speed
Time
Which of the following graphs represents an object moving with constant acceleration?
A straight line on a distance-time graph
A curved line on a speed-time graph
A horizontal line on a speed-time graph
A straight line on a speed-time graph
If a car travels at a constant speed of 60 km/h, how far will it travel in 2 hours?
60 km
120 km
30 km
90 km
In a distance-time graph, what does a steeper slope indicate compared to a less steep slope?
Higher speed
Lower speed
Constant speed
No movement
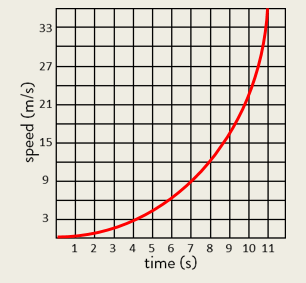
What is this graph showing?
Gradually slowing down
Gradually speeding up
Constant speed
Stopped

What is this graph showing?
At rest
Acceleration
Constant speed of 1 m/s
Gradually speeding up
What is this graph showing?
Constant speed
Gradually speeding up
Gradually slowing down
At rest
Accelerating gradually
Stopping
Slowing down constantly
Speeding up constantly
What is this graph showing?
Fast constant speed
Slow constant speed
At rest
Accelerating

What is this graph showing?
Constantly slowing down
Constantly speeding up
Acceleration
Returning to starting point
What is this graph showing?
Two objects speeding up constantly
Two objects slowing down constantly
Two objects accelerating
Two objects at rest

What is this graph showing?
Fast constant speed
Slow constant speed
Accelerating
At rest
What is the graph showing?
Slowing down moving toward start
Speeding up moving toward start
Slowing down moving away from start
Speed up moving away from start
What is the graph showing?
Speeding up moving away from start
Speeding up moving towards start
Slowing down moving towards start
Slowing down moving away from start
What is the graph showing?
Constant speed towards start
Constant speed away from start
Acceleration away from start
Acceleration towards start

Slows down toward start
Slows down away from start
Speeds up while toward start
Speeds up away from start

What is the graph showing?
Slows down toward start
Speeds up toward start
Slows down away from start
Speeds up away from start
What is the graph showing?
Constant high speed
Stopped
Accelerating
Constant low speed

What is the graph showing?
Constant speed away from start
Constant speed toward start
Accelerating away from start
Stopped toward start
What is this graph showing?
Gradually slowing down
Gradually speeding up
Constant speed
Stopped
What is this graph showing?
At rest
Acceleration
Constant speed of 1 m/s
Gradually speeding up
Accelerating gradually
Stopping
Slowing down constantly
Speeding up constantly
What is this graph showing?
Constantly slowing down
Constantly speeding up
Acceleration
Returning to starting point
Segment C-D: The bus is _________________. It has stopped.
accelerating
decelerating
constant speed
at rest
Segment D-E: The bus is _________________. It is gradually increasing it's speed.
accelerating
decelerating
constant speed
at rest

A
B
C

what is the y axis called?
speed
time
distance

The car is stopped in scenario -
A
B
C
The car is traveling at constant speed in scenario-
A
B
C

What is happening during point A to B?
not moving
increasing speed at a constant rate
moving at a constant speed
moving at 10 m/s2 acceleration

A runner races in the 100 meter dash. It takes her 10 seconds to finish. What is her average speed?
10 m/s
1000 m/s
100 seconds
10 seconds
Segment O-A: The bus is _________________. It's speed changes from 0m/s to 10 m/s in 5 seconds.
accelerating
decelerating
constant speed
at rest
What does the slope of a distance-time graph represent?
Speed
Acceleration
Distance
Time
If a distance-time graph is a horizontal line, what does this indicate about the object's motion?
The object is moving at a constant speed
The object is accelerating
The object is stationary
The object is moving backwards
On a speed-time graph, what does the area under the curve represent?
Distance traveled
Acceleration
Speed
Time
Which of the following graphs represents an object moving with constant acceleration?
A straight line on a distance-time graph
A curved line on a speed-time graph
A horizontal line on a speed-time graph
A straight line on a speed-time graph
If a car travels at a constant speed of 60 km/h, how far will it travel in 2 hours?
60 km
120 km
30 km
90 km
In a speed-time graph, what does a line with a negative slope indicate?
The object is speeding up
The object is slowing down
The object is moving at a constant speed
The object is stationary


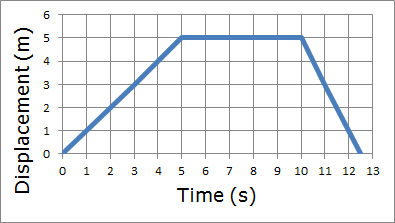
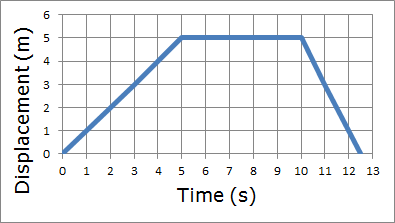


Which is true about their motions?

Which statement is true about velocity?
Must have measurement of speed.
Must have a measurement of speed and direction.
Must have only direction.
Has neither a measurement of speed or direction.


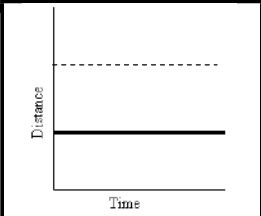

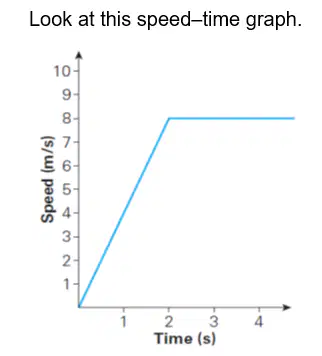
Describe the motion of the object shown in the graph.
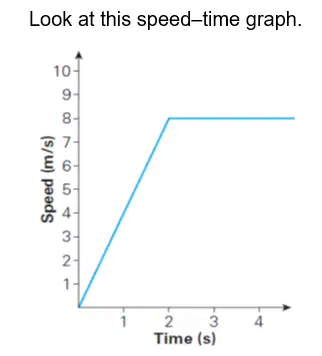
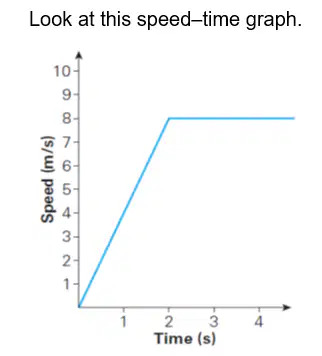
Calculate the acceleration over the first 2 seconds.
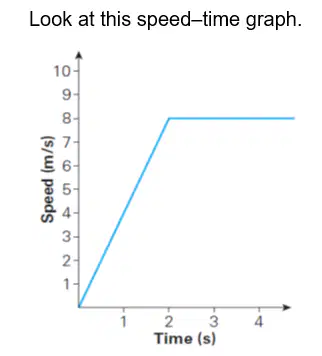
Determine the acceleration between t = 2 and t = 4.
Calculate the distance travelled after the first 2 seconds.
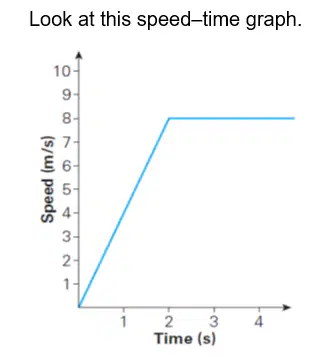
Determine how far the object travels in 4 seconds.
Recall what the gradient of a distance–time graph indicates.
Recall what the gradient of a speed–time graph indicates.
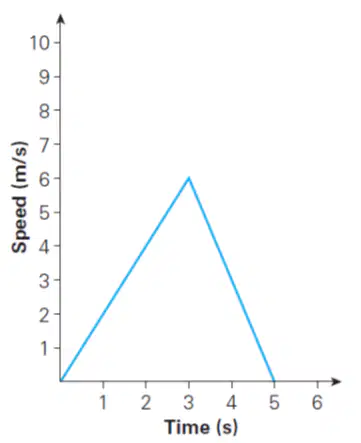
Calculate the acceleration in the first 3 seconds.
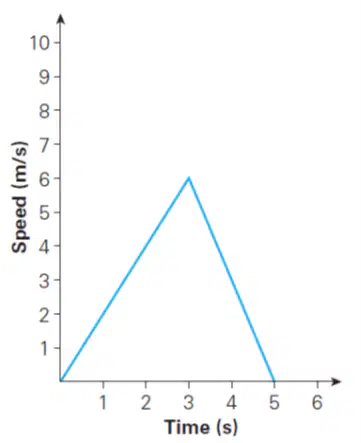
Calculate the acceleration for the next 2 seconds.
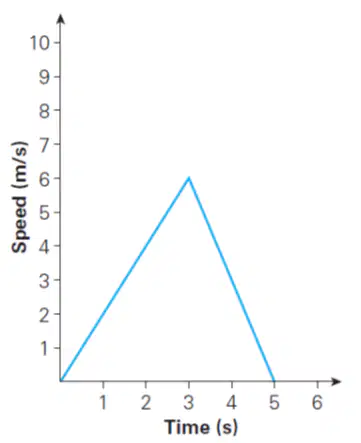
Calculate the distance the object has travelled after 5 seconds.

Total distance divided by total time, for an object shows:
acceleration
the size of one's toupee
absolute speed
average speed

During which time interval is the object not moving?
9:00 to 11:00
11:00 to 12:00
12:00 to 12:30
12:30 to 14:00
A biker travels 25 miles in 2 hours. What is the average speed in miles per hour?
50 mph
20 mph
12.5 mph
20 km/h

A change in ________ in a certain amount of time is motion.
speed
appearance
position
weight

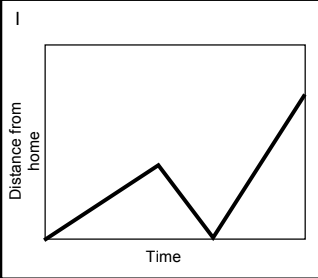
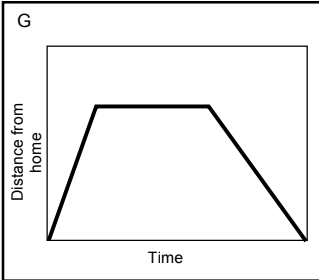


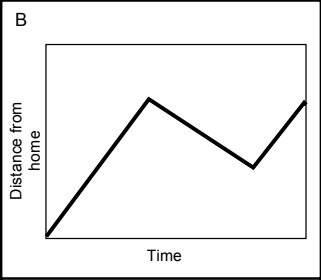
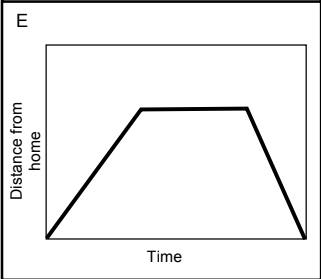




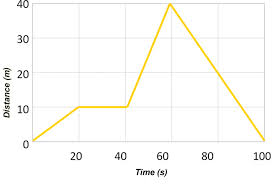
A car traveling at a constant speed covers a distance of 750 m in 25 s. What is the car's speed?
0.3 m/s
30 m/s
18750 m/s
18.75 m/s
A passenger elevator travels from the first floor to the 60th floor, a distance of 210 m, in 35 seconds. What is the elevator's speed?
3.5 m/s
1.7 m/s
6 m/s
0.167 m/s
A motorcycle is moving at a constant speed of 40 km/hr. How long does it take the motorcycle to travel a distance of 10 km?
15 minutes
4 minutes
0.25 hours
4 hours
How far does a car travel in 0.75 hours if it is moving at a constant speed of 88km/hr.
117.3 km
66 km
44 km
8.5 km
A long distance runner is running at a constant speed of 5 m/s. How long does it take the runner to travel 1km?
200 seconds
20 seconds
5 minutes
500 seconds
How long did it take this object to travel 10 m?
0 s
10 s
15 s
20 s

What does this graph represent?
Constant speed
Acceleration
Not moving

At what rate did the rain fall?
2 cm per hour
1/4 cm per hour
1/2 cm per hour
4 cm per hour
Which runner won the race?
A
B
C
What does this graph represent?
Constant Speed
Acceleration
Not moving


