
 Worksheets
Từ vựng miêu tả trend (T8 - T12/2024)
Total questions: 57
Worksheet time: 19mins
Name
Class
Date
1.

1. In Darwin, the water level in reservoirs ________ from approximately 47% in Oct 2009 to 26% in Oct 2010.
a)
fell considerably
b)
increased slightly
c)
remained stable
d)
rose sharply
2.
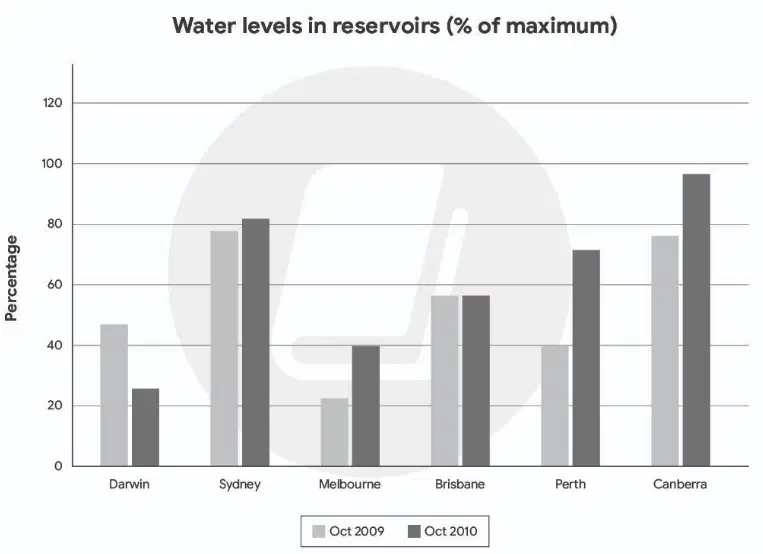
2. The water level in Sydney’s reservoirs saw a ________ rise, from about 78% to 82% over the one-year period.
a)
marginal
b)
sharp
c)
substantial
d)
considerable
3.
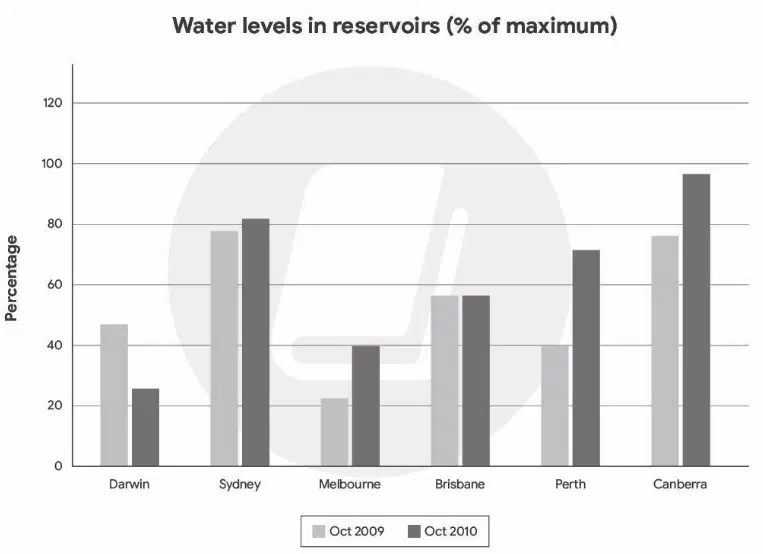
3. Between October 2009 and October 2010, the percentage of water in Melbourne's reservoirs ________.
a)
grew significantly
b)
dropped marginally
c)
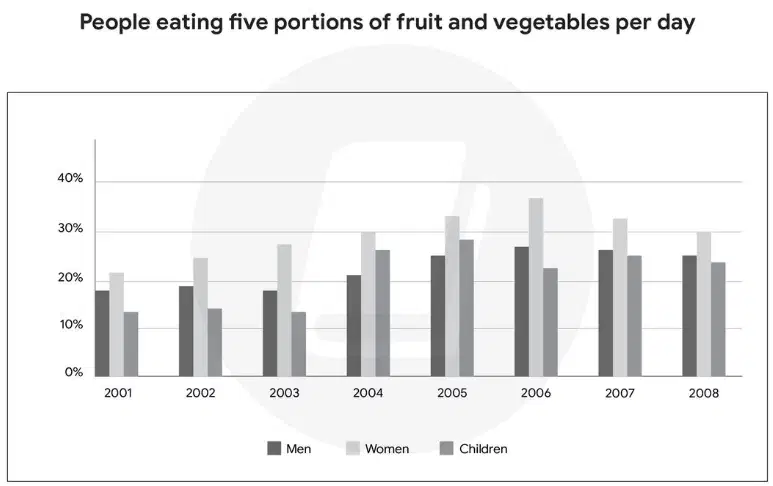
stayed the same
d)
increased slightly
4.

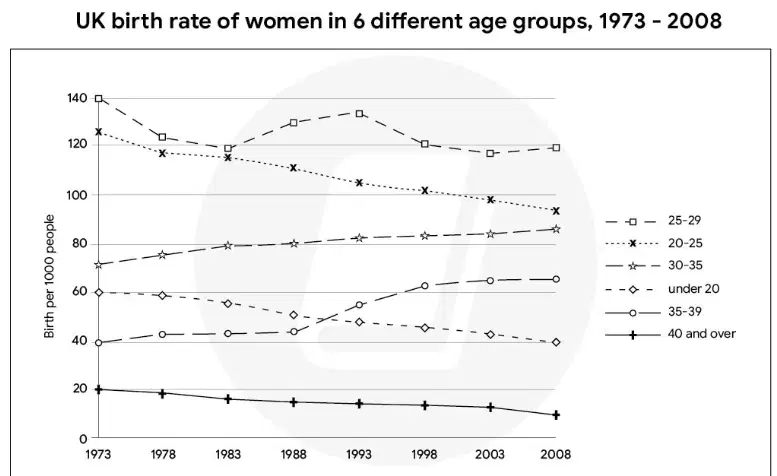
4. Which sentence best describes the water level in Brisbane?
a)
The water level remained stable over the period.
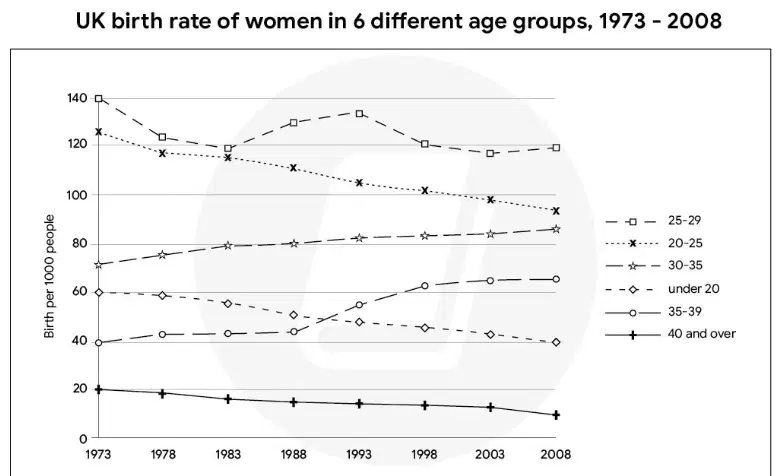
b)
The water level plunged from 2009 to 2010.
c)
There was a sharp increase in the water level.
d)
The water level went up considerably.
5.

5. The most dramatic change can be seen in Perth, where the water level ________ from 40% to over 70%.
a)
soared
b)
declined
c)
grew slowly
d)
dropped slightly
6.

6. In Canberra, the water level experienced a ________ growth, rising from roughly 76% to 97% in a year.
a)
substantial
b)
slight
c)
slow
d)
steady
7.

1. The percentage of people aged 35-44 going to the gym ________ from under 10% in 1990 to 40% in 2010.
a)
rose steadily
b)
fell sharply
c)
fluctuated
d)
remained stable
8.
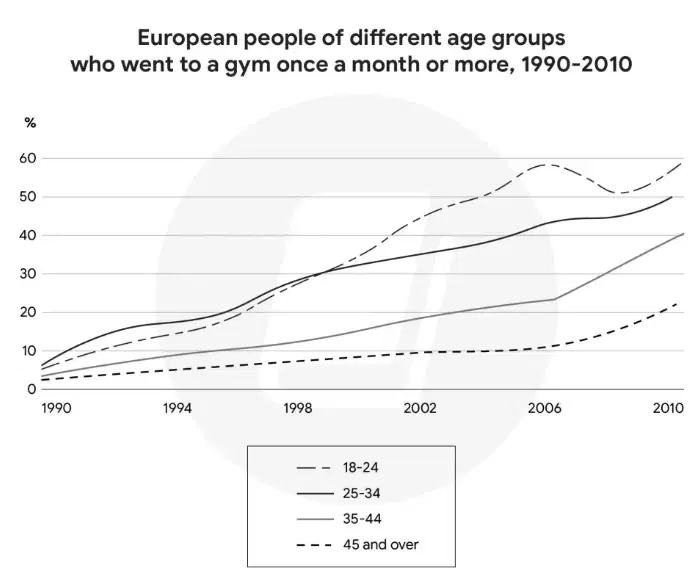
2. Between 1990 and 2010, the figure for the 45 and over age group experienced a ________ growth.
a)
slight
b)
sharp
c)
substantial
d)
rapid
9.

3. The proportion of gym-goers aged 25-34 ________ to become the highest of all groups after 1998.
a)
climbed significantly
b)
dropped slightly
c)
grew moderately
d)
went down sharply
10.

4. From 2006 to 2010, the figure for the 18-24 age group ________ around 50% before ending the period at that level.
a)
showed some fluctuations
b)
saw a steady fall
c)
experienced a soar
d)
stayed unchanged
11.

5. In general, the trend for all age groups was ________ over the 20-year period.
a)
upward
b)
downward
c)
stable
d)
erratic
12.

1. The passenger kilometers travelled by bicycle ________ between 1990 and 2000.
a)
decreased slightly
b)
rose sharply
c)
remained unchanged
d)
soared
13.
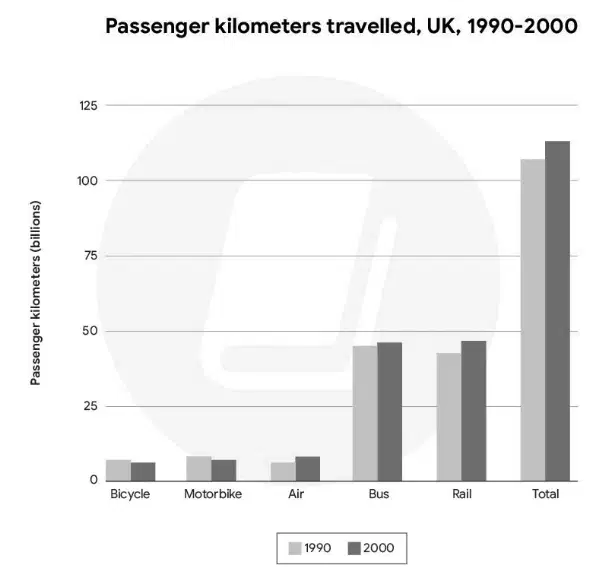
2. The figure for motorbikes saw a ________ from just under 10 billion to around 8 billion kilometers.
a)
slight fall
b)
significant increase
c)
steady climb
d)
sharp drop
14.

3. In contrast, air travel ________, nearly doubling from approximately 5 to 10 billion kilometers.
a)
grew substantially
b)
declined moderately
c)
stayed the same
d)
fell slightly
15.
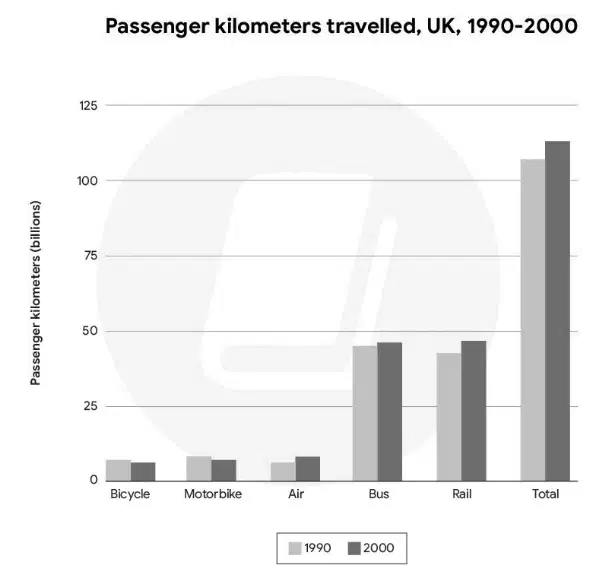
4. The distance travelled by bus ________ over the 10-year period, with only a very small change.
a)
remained relatively stable
b)
increased significantly
c)
dropped considerably
d)
fluctuated wildly
16.
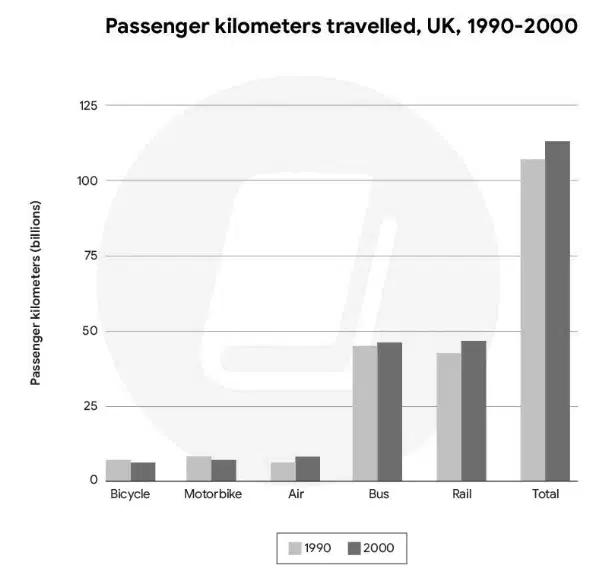
5. There was a ________ rise in rail travel, from about 42 billion to 47 billion kilometers.
a)
noticeable
b)
marginal
c)
sharp
d)
slight
17.

6. Overall, the total passenger kilometers for all modes of transport ________ from 1990 to 2000.
a)
went up slightly
b)
fell dramatically
c)
stayed constant
d)
experienced a plunge
18.

1. The percentage of households with a washing machine ________ at 98% in both years.
a)
remained unchanged
b)
increased slightly
c)
fell sharply
d)
fluctuated
19.

2. The figure for computers in households ________ from 50% in 1998 to 78% in 2002.
a)
grew substantially
b)
declined marginally
c)
saw a slight rise
d)
dropped
20.

3. Ownership of cell phones ________, quadrupling from 20% to 80% in just four years.
a)
soared
b)
fell steadily
c)
grew slowly
d)
remained stable
21.

4. In contrast, the proportion of households with a video recorder ________ from 75% to 60%.
a)
saw a considerable fall
b)
experienced a slight dip
c)
rose significantly
d)
stayed constant
22.
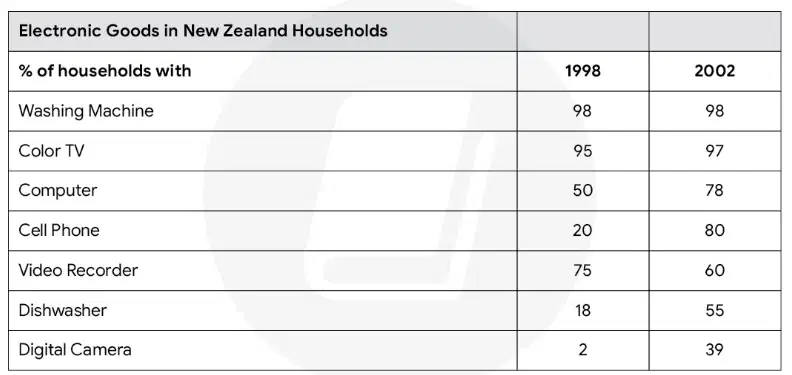
5. There was a ________ in the figure for dishwashers, which jumped from 18% to 55%.
a)
significant increase
b)
slight decrease
c)
marginal growth
d)
sharp fall
23.

6. The most dramatic rise from a low starting point was in digital cameras, which ________ from only 2% to 39%.
a)
climbed sharply
b)
increased moderately
c)
went up slowly
d)
fell slightly
24.

1. The percentage of students taking Art ________ from 17% in 1985 to 15% this year.
a)
dropped slightly
b)
rose sharply
c)
remained stable
d)
fell significantly
25.

2. In contrast, the figure for Cookery saw a ________, from 14% to 19%.
a)
moderate increase
b)
slight fall
c)
significant drop
d)
rapid decline
26.

3. The proportion of students enrolling in Modern languages ________ from 24% to 17%.
a)
decreased considerably
b)
grew slightly
c)
remained unchanged
d)
plunged
27.

4. Fitness and dance was the only course that ________ at 22% in both years.
a)
stayed the same
b)
fluctuated
c)
increased
d)
decreased
28.

5. The two courses, Local history and Music appreciation, which were available in 1985, ________ this year.
a)
were replaced
b)
became more popular
c)
saw a slight rise
d)
remained constant
29.
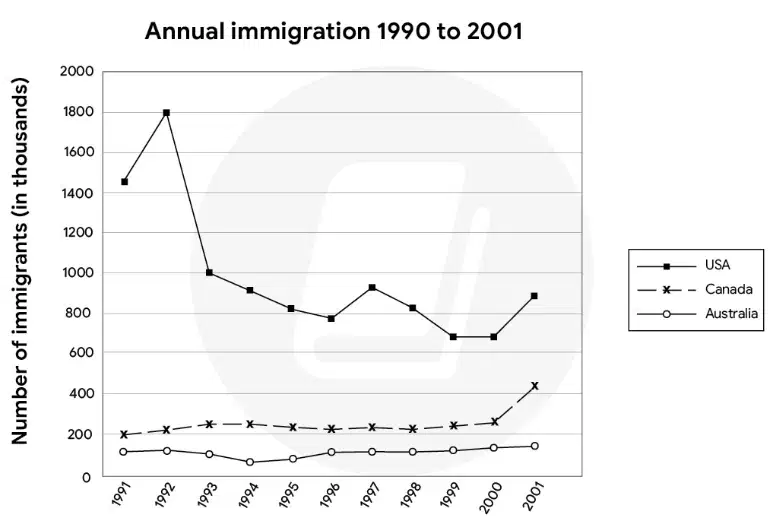
1. After peaking in 1992, the number of immigrants to the USA ________ to under one million by 1993.
a)
plummeted
b)
rose steadily
c)
remained stable
d)
decreased gradually
30.

2. From 1993 to 2000, immigration levels to the USA showed some ________ but stayed below one million.
a)
fluctuations
b)
steady growth
c)
sharp declines
d)
stability
31.
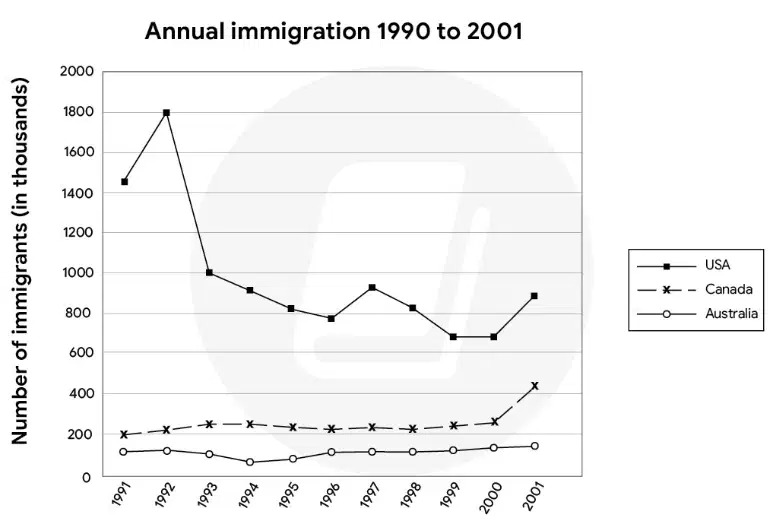
3. The number of immigrants to Australia saw a ________ over the entire period.
a)
gradual and steady rise
b)
sharp fall
c)
significant peak
d)
period of fluctuation
32.

4. For most of the 1990s, the figure for Canada ________ around the 200,000 mark.
a)
remained relatively stable
b)
soared
c)
plunged
d)
grew rapidly
33.
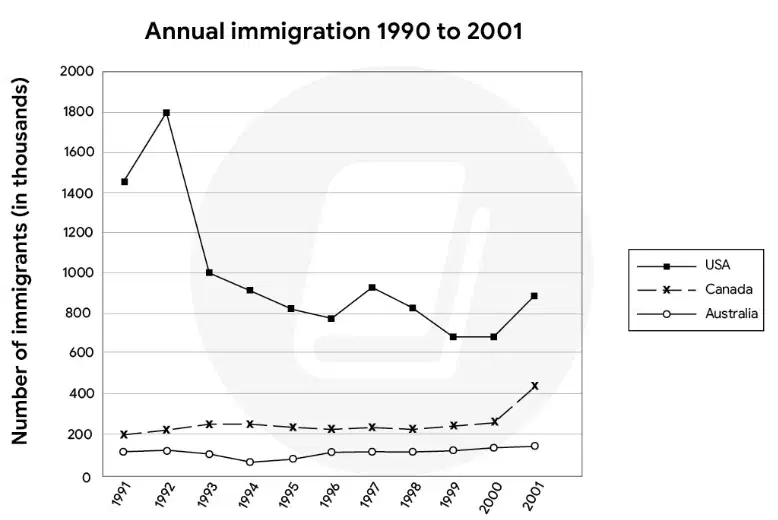
5. In the final year, there was a ________ in immigration to Canada, reaching over 400,000.
a)
sharp increase
b)
slight dip
c)
gradual fall
d)
moderate growth
34.

1. The percentage of men eating five portions of fruit and vegetables ________ between 2001 and 2006.
a)
rose steadily
b)
fell sharply
c)
fluctuated wildly
d)
remained stable
35.
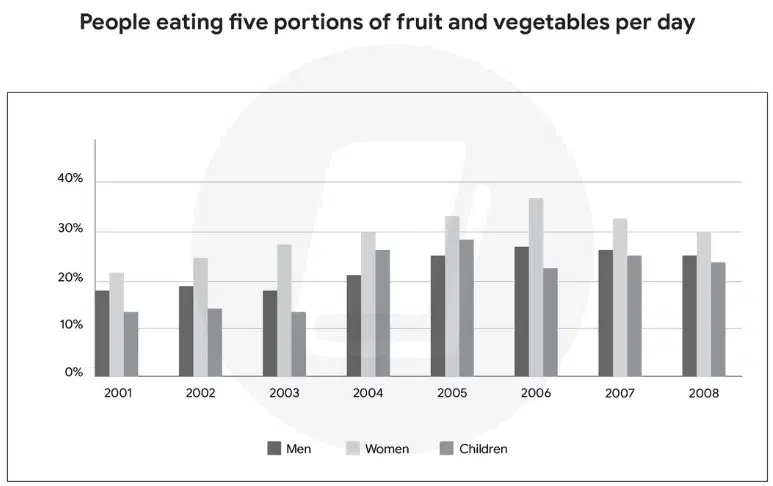
2. The figure for women ________ at approximately 36% in 2006 before falling back to around 30% by 2008.
a)
peaked
b)
bottomed out
c)
plummeted
d)
soared
36.
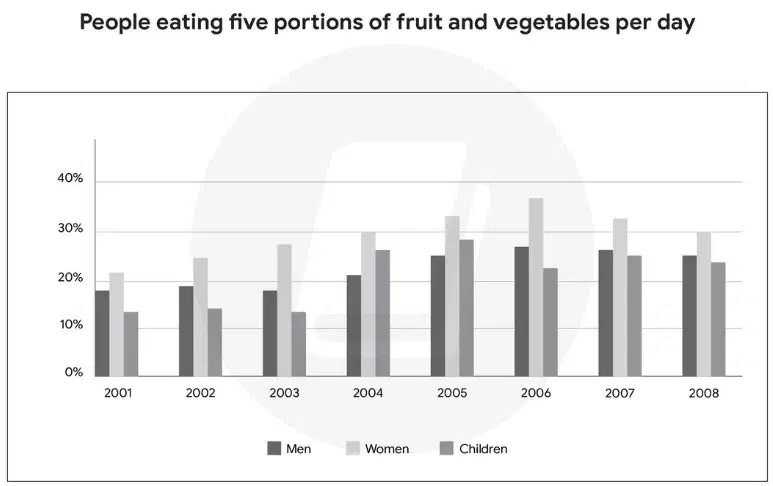
3. The proportion of children consuming enough fruit and vegetables saw some ________ but ended the period slightly higher than where it started.
a)
fluctuations
b)
steady growth
c)
sharp decline
d)
constant stability
37.
4. In 2007, the figures for all three groups showed a ________ compared to the previous year.B22
a)
slight decrease
b)
significant increase
c)
sharp drop
d)
period of stability
38.
1. The birth rate for women aged 20-25 ________ from 140 per 1000 people in 1973 to around 115 by 2008.
a)
fell dramatically
b)
rose steadily
c)
remained stable
d)
fluctuated wildly
39.

2. In stark contrast, the figure for women aged 30-35 showed ________ throughout the entire period.
a)
a consistent rise
b)
a sharp drop
c)
a period of stability
d)
wild fluctuations
40.

3. The birth rate for the 25-29 age group ________ around 1993 before beginning a gradual decline.
a)
peaked
b)
bottomed out
c)
plummeted
d)
soared
41.
4. Around 1998, the birth rate for women aged 35-39 ________ the rate for those under 20.
a)
overtook
b)
fell below
c)
stabilized with
d)
rose sharply above
42.

5. The birth rate for women under 20 ________ over the 35-year period, despite some minor fluctuations.
a)
experienced a general decline
b)
saw a sharp increase
c)
remained unchanged
d)
grew steadily
43.

1. The percentage of food bought in Country A's supermarkets ________ from 10% in 1998 to 35% in 2008.
a)
rose dramatically
b)
fell slightly
c)
remained stable
d)
increased marginally
44.

2. In Country B, the figure for goods bought in supermarkets ________ between 1998 and 2008.
a)
increased slightly
b)
dropped significantly
c)
saw a sharp rise
d)
remained unchanged
45.

3. There was a ________ in the proportion of goods purchased in supermarkets in Country C, from under 5% to nearly 15%.
a)
significant climb
b)
slight fall
c)
period of stability
d)
sharp drop
46.

4. The percentage of food bought in Country B's supermarkets ________ from roughly 23% to 28% over the decade.
a)
experienced a moderate growth
b)
plummeted
c)
soared
d)
decreased considerably
47.

5. By 2008, the percentage of goods bought in supermarkets in Country B was ________ the percentage of food bought.
a)
slightly lower than
b)
much higher than
c)
exactly the same as
d)
slightly higher than
48.

1. The sales of adult fiction books ________, becoming the most popular category by 2012.
a)
soared
b)
plummeted
c)
remained stable
d)
decreased slightly
49.

2. In contrast, the percentage of Biography books sold saw a ________ over the 40-year period.
a)
significant drop
b)
steady rise
c)
slight fluctuation
d)
sharp increase
50.

3. The proportion of Children's fiction sales experienced a ________, from 20% in 1972 to 25% in 2012.
a)
moderate growth
b)
dramatic fall
c)
period of stability
d)
sharp decline
51.

4. The category of 'Others' ________ by more than half, from 25% in 1972 to just 12% in 2012.
a)
fell considerably
b)
rose slightly
c)
stayed unchanged
d)
grew substantially
52.

5. The sales of Travel books ________ in 1992 before falling to their lowest point in 2012.
a)
peaked
b)
hit a low
c)
dropped
d)
stabilized
53.

1. The number of people employed in Sales ________ from approximately 155,000 in 2001 to 165,000 in 2008.
a)
increased slightly
b)
fell sharply
c)
remained stable
d)
soared
54.

2. In contrast, the figure for Accounting saw a ________ of about 10,000 people over the 7-year period.
a)
moderate decrease
b)
slight increase
c)
sharp rise
d)
period of stability
55.

3. The most significant growth was in Computing, where employment numbers ________ from roughly 58,000 to 78,000.
a)
rose substantially
b)
dropped slightly
c)
stayed the same
d)
fell considerably
56.

4. The number of people working in Farming ________, from nearly 30,000 down to under 20,000.
a)
fell considerably
b)
grew steadily
c)
fluctuated
d)
increased slightly
57.

5. The number of jobs in Nursing saw a slight rise, from about 56,000 to 60,000, while the figure for Computing ________.
a)
grew much more significantly
b)
decreased dramatically
c)
saw a similar increase
d)
remained constant
100 %

